
Your Guide to the Best Financial Statement Analysis Tool
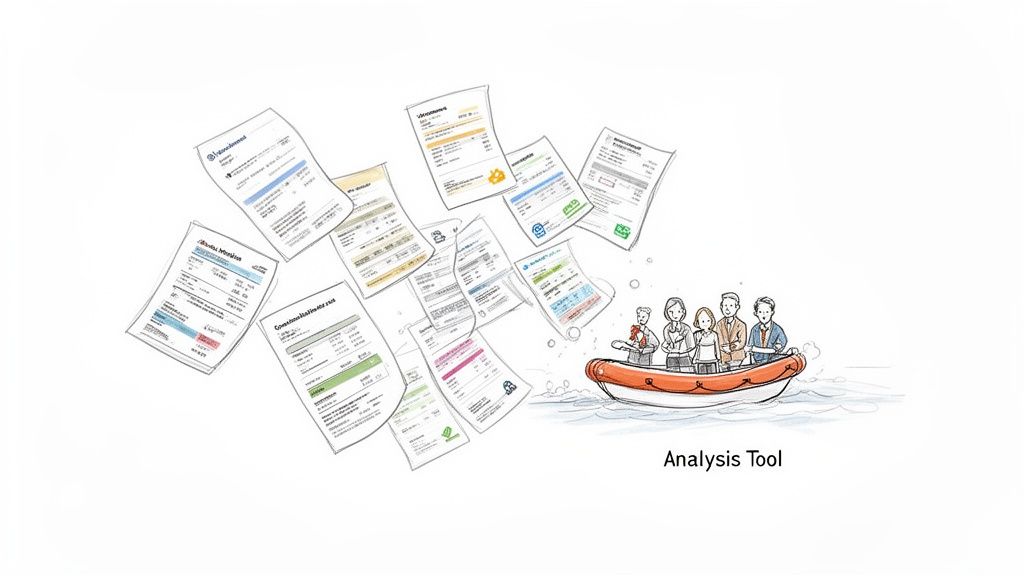
Let's get straight to it. A financial statement analysis tool is a piece of software designed to do the heavy lifting your finance team dreads. It automatically pulls, organizes, and makes sense of the data trapped in all kinds of financial documents—from invoices and bank statements to complex income reports.
Essentially, it acts as a translator, turning piles of unstructured information into clean, organized data you can actually use.
What Is a Financial Statement Analysis Tool?
Picture your finance department buried under a mountain of paperwork and endless PDFs. They spend a huge chunk of their day just typing numbers from one screen to another—transferring data from scanned invoices, various bank statements, and inconsistent commission reports into a spreadsheet.
This manual grind isn't just slow; it’s a recipe for human error. A single misplaced decimal or transposed number can throw off your entire financial picture, leading to bad decisions based on bad data. This is the exact headache that a modern financial statement analysis tool is built to solve.
It’s far more than a simple copy-paste bot. This software uses intelligent technology to actually read and understand your financial documents, no matter how messy the layout is. It finds the important information, pulls it out, and arranges it neatly in a structured format, like a spreadsheet or database.
From Chaos to Clarity
Think of this tool as the most efficient assistant your finance department could ask for. Instead of someone spending a whole afternoon wrestling with a dozen different vendor invoices, the software can process them all in a matter of minutes.
It intelligently identifies and grabs the key details you need, such as:
- Invoice numbers and payment due dates
- Individual line-item details and totals
- Vendor names and company addresses
- Policy numbers and premium amounts
This completely eliminates the soul-crushing task of manual data entry, freeing up your team for work that requires their actual expertise. More importantly, it delivers the clean, reliable data needed for real analysis. With a good tool, you can finally focus on understanding the difference between P&L and Balance Sheet instead of getting bogged down in data prep.
The demand for this kind of efficiency isn't just a hunch; the numbers back it up. The global Financial Analytics Software market hit $8.65 billion in 2025 and is expected to grow at a 10% compound annual growth rate through 2033. This boom is fueled by increasingly complex regulations and the fact that 90% of CFOs now view real-time analytics as essential. It's a shift that's helping companies cut their financial reporting errors by up to 40%. You can dig deeper into this trend by exploring the full market research on financial analytics software.
By turning messy documents into a source of clear, actionable insight, these tools empower teams to focus on strategy and decision-making rather than data transcription. It’s a fundamental shift from reactive data entry to proactive financial management.
How Financial Analysis Tools Actually Work
Ever wondered what's really going on inside a financial statement analysis tool? It’s not magic, but it can feel like it. Think of it as a super-fast digital assistant, doing in seconds what takes a human analyst hours or even days. The whole point is to turn a pile of messy, unorganized documents into financial intelligence you can actually trust and use.
It all starts with getting the information off the page—or out of the PDF. This is where most manual processes hit a wall, but it’s exactly where these modern tools shine.
The Core Engine: From Document To Data
The moment you upload a file, the software gets to work. It doesn’t just see an image; it analyzes the document’s entire layout to understand what it’s looking at. This process breaks down into four key jobs.
-
Intelligent Data Extraction: The tool uses a combination of advanced optical character recognition (OCR) and AI to read everything. It's smart enough to find "Total Amount Due" or "Policy Start Date" no matter where they are on the page. This goes way beyond just turning a picture of text into actual text; it’s about understanding what that text means. To get a better handle on the tech behind this, check out our guide on what is intelligent document processing.
-
Data Normalization and Standardization: Let's be honest, data from different sources is never consistent. One document might use "05/10/2024," another "May 10, 2024," and a third "10-MAY-24." The tool automatically cleans this up, converting every variation into a single, standard format (like YYYY-MM-DD). It does the same for currencies, addresses, and company names, so you’re always comparing apples to apples.
-
Automated Calculations and Verification: Once the data is clean and uniform, the tool can start running the numbers. It will add up line items to make sure the subtotal is correct, calculate the right sales tax, or check a commission against a rate sheet. If it finds something that doesn't add up—like an invoice total that doesn't match the line items—it flags the document for a human to review. This step alone catches countless expensive mistakes before they happen.
-
Data Structuring and Export: Finally, after all that work, the tool organizes the clean, verified data into a structured format like a perfect spreadsheet. Instead of a folder full of random PDFs, you get a clean table with columns for "Vendor Name," "Invoice Total," and "Due Date," all ready for you to analyze.
This automated workflow is the engine that powers it all. It takes over the tedious, error-prone tasks that eat up so much of a professional's day.
Visualizing The Story Behind The Numbers
Pulling and organizing data is just step one. The real magic happens when you can actually gain insight from it, and that’s where visualization makes all the difference. A great analysis tool doesn’t just hand you a spreadsheet; it helps you see the story the numbers are telling.
A financial statement analysis tool bridges the gap between raw data and strategic insight. By automating the foundational tasks of extraction and calculation, it frees up human experts to focus on what they do best: interpreting trends, identifying risks, and making informed decisions.
Most of these tools can plug right into business intelligence (BI) platforms or come with their own dashboards. This lets you instantly turn that structured data into things you can actually use, like:
- Trend Graphs: See how revenue or expenses change over time to spot seasonal dips and spikes.
- Comparison Charts: Visually compare how profitable different product lines are or how much each department is spending.
- Performance Dashboards: Get a live look at your most important numbers (KPIs), like gross profit margin or how quickly customers are paying their bills.
Best of all, every single action the tool takes is logged—from the first scan to the final calculation. This creates a perfect, unchangeable audit trail. If an auditor ever asks about a specific number, you can trace it right back to its source on the original document in seconds. It’s total transparency and peace of mind.
How to Choose the Right Financial Statement Analysis Tool
Picking the right tool to analyze financial statements can feel overwhelming, but it really boils down to one thing: finding a solution that solves your team's actual day-to-day problems. It's easy to get wowed by flashy features, but the best tool is the one that fits how you work, not one that forces you to change everything.
This guide will help you cut through the noise. We'll walk through the essential questions you should ask to find a tool that aligns with your workflow, budget, and the people on your team.
Start With Your Team's Technical Skill
First things first, who’s actually going to be using this tool every day? Your answer will point you toward either a simple, no-code platform or a more complex solution that requires developers.
- No-Code Platforms: These are built for business pros—accountants, procurement managers, or loan officers. Tools like DocParseMagic use intuitive, drag-and-drop interfaces so you don't need to write a single line of code.
- Developer-Heavy Solutions: Think APIs and software development kits (SDKs). These offer incredible flexibility but demand a programming team to get them up and running and to keep them maintained. They come with a much steeper learning curve and a bigger price tag for implementation.
For most finance and operations teams, a no-code solution is the quickest way to see a return. It puts the power directly into the hands of the people who handle the documents, letting them build and manage their own automation without getting stuck in an IT ticket queue.
Evaluate Document and System Compatibility
I've seen it happen time and again: a team buys a fancy new tool, only to find out it chokes on half their documents or won't talk to their existing software. Before you commit to anything, you have to check its compatibility.
Start with your documents. Does the tool you’re considering handle everything you throw at it? This means crisp, born-digital PDFs, but also messy scans, crumpled invoices, and even photos of receipts. A truly useful tool won't make you manually convert files just to get started.
Next, look at integration. How will this new piece of software play with the systems you already rely on?
The most effective financial statement analysis tool should seamlessly integrate with your accounting software (like QuickBooks or Xero), Enterprise Resource Planning (ERP) systems, and other platforms. This ensures a smooth flow of data from extraction all the way to your system of record, eliminating manual data transfer between applications.
Without that solid connection, you aren't really automating anything. You're just moving the bottleneck from one step in your process to another.
The financial services software market is growing fast, expected to be worth $162.59 billion in 2025 and jump to $180.96 billion by the end of 2026. This 11.3% growth is fueled by businesses finally adopting digital tools, with small and medium-sized companies making up 35% of that user base. For teams stuck reconciling commissions or verifying income by hand, automation can slash processing times by 70% and get rid of costly mistakes.
Prioritize Accuracy and Reliability
At the end of the day, it all comes down to accuracy. A tool that pulls the wrong numbers is worse than no tool at all because it quietly poisons your financial records with bad data. Always ask a vendor for their accuracy benchmarks, but more importantly, test it yourself. Run a trial using your own real-world documents—the messy ones, not just the perfect examples.
The magic behind these tools follows a simple, three-step process: they extract the data, normalize it so everything is consistent, and then structure it so you can analyze it.
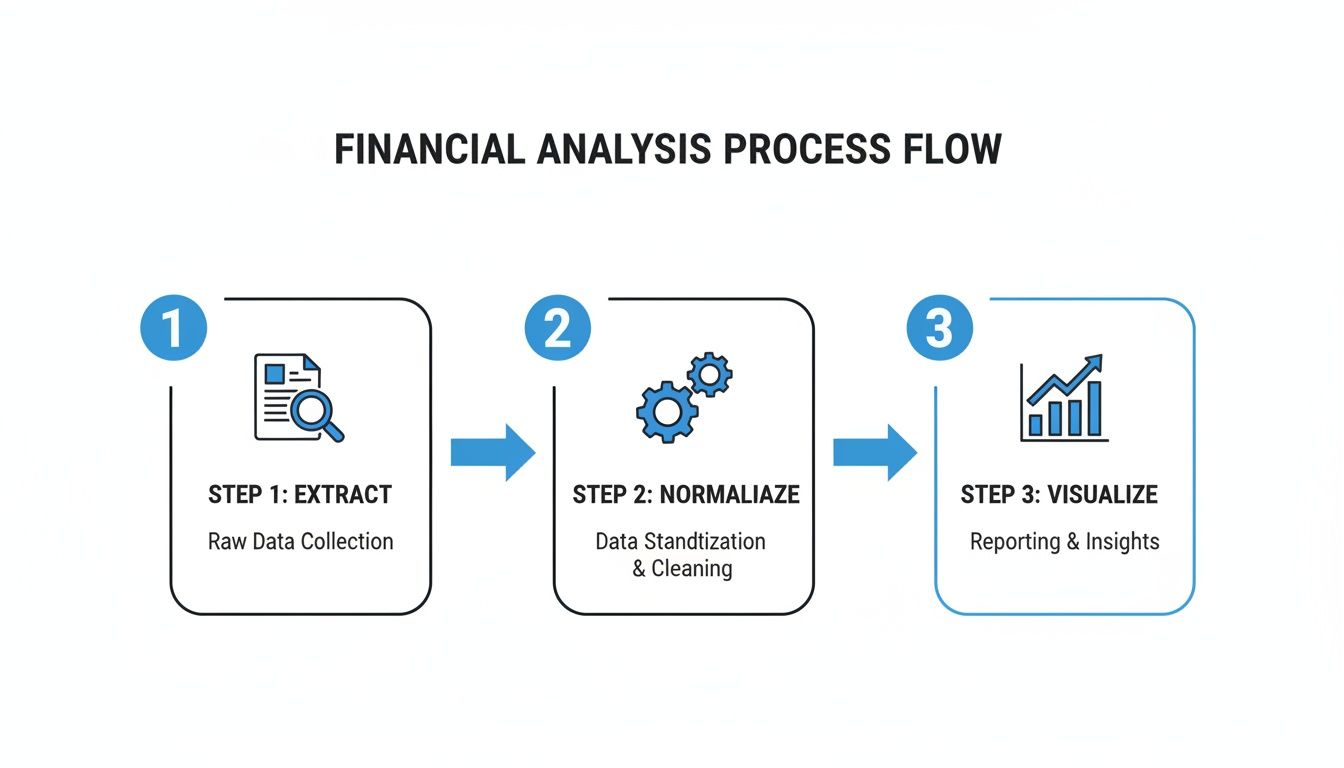
This "Extract, Normalize, and Visualize" workflow is what turns a pile of raw documents into clear, actionable insights. But the entire chain is only as strong as its first link. That’s why a powerful and accurate parsing engine isn't just a nice-to-have; it's a must-have. You can learn more about this critical first step in our deep dive on document data extraction software.
As you weigh your options, it's smart to look at roundups that compare different AI tools for financial analysis to see what technology is out there. By keeping these core principles in mind—usability, compatibility, and accuracy— you can choose a tool that will genuinely help your team and deliver a fantastic return on your investment.
Real-World Use Cases for Financial Analysis Automation
It’s one thing to talk about features and theory, but seeing a financial statement analysis tool in the wild is where the lightbulb really goes on. How does this kind of technology actually help teams get their work done? Let’s step away from the abstract and look at some real-world stories.
These examples show how automation can take those tedious, error-prone tasks and turn them into fast, accurate, and even strategic parts of the job. We'll dive into scenarios from accounting, insurance, and procurement to see the impact firsthand.
Each case highlights real efficiency gains and a clear return on investment, helping you imagine how this could solve your own team's headaches.
Streamlining Accounting with Automated Three-Way Matching
Think about the classic bottleneck for any accounting team: three-way invoice matching. For one mid-sized manufacturing company, this was a huge time-sink. They were spending dozens of hours every month manually comparing invoices, purchase orders, and receiving reports.
The problem was the process itself—it was completely manual. An accounts payable clerk had to find an invoice, track down the matching purchase order, and then pull up the goods receipt note from the warehouse. Any little mismatch in price or quantity sent them down a rabbit hole of investigation, delaying payments and frustrating vendors.
Their solution was to implement a tool to automate the whole workflow. They set it up so all three documents—the invoice, PO, and receipt—were automatically read and the key data pulled into one central dashboard.
The result was immediate. The software instantly flagged any discrepancies, turning a process that used to take up a huge chunk of the week into something that just runs in the background. Now, the team only has to step in to review the exceptions. This freed up over 40 hours of manual work a month and practically eliminated late fees. You can explore other ways to improve your accounting workflows with this kind of automation.
Accelerating Commission Reconciliation for Insurance Brokers
An independent insurance brokerage was drowning in paperwork trying to reconcile commissions. They were getting complex, multi-page statements from dozens of carriers, and every single one had a different format. Trying to manually pull out policy numbers, premiums, and commission rates to make sure they were paid correctly was a nightmare.
This variety of statement layouts made data entry incredibly slow and full of errors. An agent could spend days just typing numbers into a spreadsheet, and even then, missed payments or wrong commission rates would slip through. That’s real money left on the table.
Using a no-code document parsing tool, the brokerage set it up to recognize and pull the key fields from each carrier’s statement, no matter how it was formatted. The software automatically grabbed policyholder names, effective dates, premium amounts, and commission percentages.
By automating data extraction from carrier statements, the brokerage transformed a reactive, manual task into a proactive, automated audit. They could now reconcile commissions in minutes, ensuring every dollar earned was accounted for.
What used to be a week-long ordeal every month now takes less than an hour. The tool puts all the data into a single, clean spreadsheet that they can instantly check against their own records. In the first quarter alone, they found thousands of dollars in unpaid commissions.
Optimizing Procurement with Rapid Vendor Proposal Analysis
A procurement manager at a growing tech company had ten different bids for a new software system sitting on her desk. Each one was a 20+ page PDF, and they all structured their pricing, service level agreements (SLAs), and timelines differently.
Trying to create a true side-by-side comparison felt impossible without spending days building a monster spreadsheet. This wasn't just tedious; it was delaying a critical business decision and increasing the risk of missing some important detail buried in the fine print.
She used an analysis tool to process all ten proposals at once. She simply configured it to find and extract the specific data points she cared about: one-time costs, recurring fees, support response times, and key contract terms.
This drive for efficiency is happening everywhere. The Financial Close Software market is expected to reach $18.5 billion by 2034, growing at an 8.1% CAGR. This boom is powered by companies looking to work smarter, with cloud solutions now making up 55% of the market by helping speed up tasks like month-end closes. Procurement teams using these tools are seeing error reductions of 45% when comparing proposals, and construction managers are processing change orders 3x faster. To see more on this explosive growth, you can read the full business research industry analysis.
In less than 30 minutes, she had a perfectly organized spreadsheet comparing all ten vendors across dozens of data points. The leadership team could finally see the true total cost of ownership for each option, allowing them to make a confident decision in a fraction of the time.
Clear Your Data Bottleneck with DocParseMagic
Let's be honest. The most advanced analytics software in the world is worthless if you feed it garbage data. All the trend forecasting and ratio analysis you can dream of means nothing if the numbers are wrong from the start.
This is the "first mile" problem of financial analysis, and it's where everything usually falls apart. Getting clean, accurate information out of source documents is the single biggest bottleneck I see teams face. Manual data entry isn't just slow; it’s a minefield of tiny errors that can quietly corrupt your entire financial reporting process.
The First Real Step to Automation
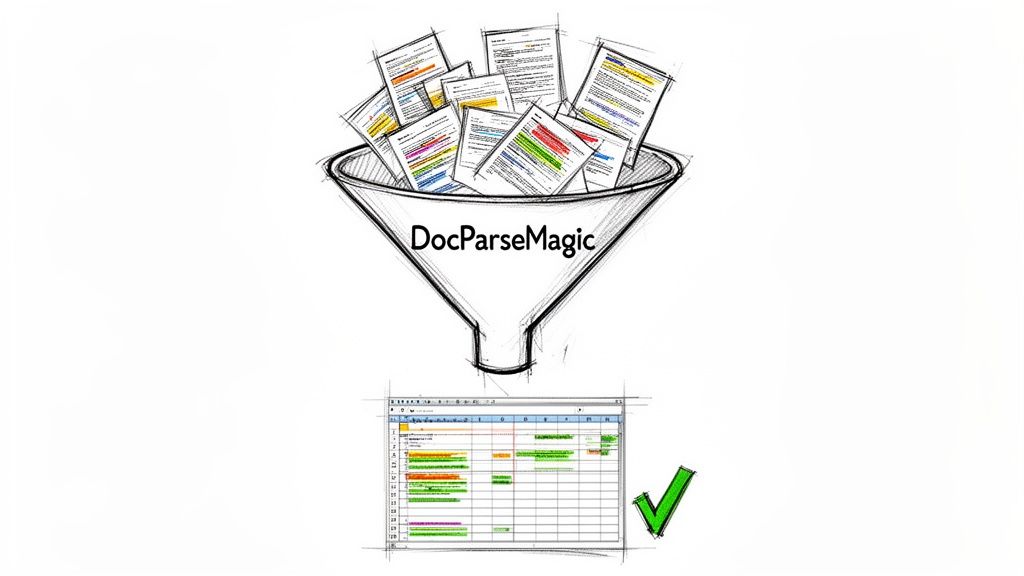
Before you can analyze anything, you have to extract the data. This is where a tool like DocParseMagic comes in. It's a no-code platform built to do one thing exceptionally well: solve that initial data extraction headache.
Think of your financial statement analysis tool as a high-performance engine. That engine needs clean fuel to run properly. DocParseMagic is the refinery that takes your raw, messy documents and turns them into the high-grade, analysis-ready data your team can actually trust.
It's designed to handle the kind of documents that make most software choke, including:
- Messy Scans: Faint, crooked, or poorly lit documents that typical OCR tools can't read.
- Wildly Different Layouts: Invoices, bank statements, and reports from hundreds of different vendors, each with its own unique format.
- Tough Document Types: Complex multi-page reports, dense commission statements, or even photos of receipts snapped on a phone.
Because it uses a simple drag-and-drop interface, anyone on your team can start automating their work in minutes. No need to wait for IT or learn a single line of code.
From Document Chaos to Structured Clarity
The real work of financial analysis isn't the math—it's the prep. Manually keying data from a stack of PDFs into a spreadsheet is more than just tedious. It's a high-risk game where one misplaced decimal can throw everything off. DocParseMagic turns that chaotic, error-prone task into a simple, automated flow.
You can’t build a house on a shaky foundation. In financial analysis, clean data is that foundation. DocParseMagic ensures your insights are built on a bedrock of accuracy by perfecting the crucial first step of data extraction.
The platform intelligently finds and pulls the exact information you need—whether it's an invoice total, a line item detail, a policy number, or a contract term—and neatly organizes it into a structured spreadsheet. This isn't just about converting images to text; it's about understanding the document's context to deliver data that’s ready to use right away.
By focusing on mastering this "first mile," you unlock the power of your entire financial workflow. Your team stops wasting hours on mind-numbing data entry and starts spending their time on what they were actually hired to do: making smart decisions that move the business forward.
Your First Step Toward Automated Financial Analysis
So, where do you start? It's not with complicated forecasting models or fancy dashboards. The real journey begins by fixing the one problem that plagues every finance and operations team: getting clean data out of your source documents.
For years, we've treated manual data entry as a necessary evil. It's not. It’s a massive, costly bottleneck that you can finally eliminate.
Modern financial statement analysis tools aren't just for massive corporations with huge IT budgets anymore. This kind of power is now accessible to any business that’s tired of wasting valuable time on manual transcription. The key is solving the "first mile" problem—perfecting how you get data from point A to point B.
Let's Get Started
You’ve seen how this works for teams in accounting, insurance, and procurement. Now it’s your turn to see the difference for yourself. The first step is simple and completely risk-free.
Stop letting manual data entry dictate your team's productivity. The time you save by automating document parsing is time you can reinvest in the strategic analysis that truly drives your business forward. It's time to take control of your data.
Ready to see what it can do with your own files?
-
Try It Yourself, Instantly: Sign up for a free trial of DocParseMagic and process your own documents in minutes. See firsthand how easily you can turn messy PDFs and scans into analysis-ready spreadsheets—no credit card required.
-
Get a Personalized Game Plan: If your team has more complex needs or specific questions about integration, our experts are here to help. Book a personalized demo to talk through your unique challenges and map out a solution that fits.
Don't let another week get lost in a mountain of paperwork. Take your first step toward streamlined financial analysis and give your team the clean, accurate data they need to shine.
Frequently Asked Questions
Whenever teams start looking into a new kind of software, a few questions always come up. It's only natural. Let's walk through the most common ones we hear about financial statement analysis tools so you can get a clear idea of how they really work.
How Is This Different from Standard OCR Software?
That’s a great question, and the answer gets right to the heart of what makes these tools so powerful. Think of standard Optical Character Recognition (OCR) software as a digital copy machine. It scans a document and turns the picture of words into text you can copy and paste. But here’s the catch: it has no clue what any of that text actually means. It just sees characters.
A true financial statement analysis tool is much smarter. It adds contextual understanding. It doesn't just read "Net Income $50,000"; it knows that figure is the net income. It sees a line item, understands it’s a subtotal, and can tell the difference between a tax amount and a final total.
Plain OCR gives you text. A financial analysis tool gives you intelligence. It turns a jumble of words and numbers into structured data you can actually use.
This is the secret sauce that lets the software figure out thousands of different document layouts without needing a specific template for every single one. It’s the difference between just digitizing words and actually automating the work.
Do I Need Technical Skills to Use These Tools?
Honestly, it depends on the tool. Some of the older, more traditional platforms are pretty complex. They’re built for developers who are comfortable working with APIs and code. While powerful, they aren't exactly user-friendly for the finance or procurement professional who’s actually doing the work.
Thankfully, there’s a new breed of no-code platforms designed to fix that. Tools like DocParseMagic are built for the people on the front lines—the ones dealing with these documents every day. The setup is visual and intuitive. If you can handle a spreadsheet, you can absolutely use a no-code tool. You’re just clicking and pointing to tell the software what to do, which puts your team in control of their own automation. No IT ticket required.
What Kind of ROI Can I Expect?
The return on your investment comes quickly, and you’ll see it in a few key places.
-
Time Savings: This is the most immediate win. We see teams slash their month-end closing process by over 50%. Tasks that used to drag on for days now get done in minutes.
-
Cost Reduction: Manual data entry is risky. A single misplaced decimal can mean overpaying a vendor or getting hit with compliance fines. By automating the process, you virtually eliminate those expensive human errors and protect your budget.
-
Strategic Value: This is where the real magic happens. When your skilled analysts aren't stuck re-typing numbers, they can finally focus on what you hired them for—spotting trends, analyzing performance, and finding opportunities. They shift from just moving data around to actually using it to drive the business forward.
Ready to stop wasting time on manual data entry and start focusing on the insights that matter? With DocParseMagic, you can transform your messy documents into analysis-ready data in minutes. Start your free trial today and see it for yourself.