
How to Integrate in Excel: A Practical Guide for 2026
You probably opened Excel because something upstream is broken.
A folder of vendor invoices is sitting in downloads. A scanned statement came in with crooked text and missing fields. Someone asked for a forecast, but the only numbers you trust are buried across PDFs, CSVs, and one workbook with formulas nobody wants to touch. Then you search integrate in excel, and half the results talk about calculus while the other half talk about importing data.
Both are right. They're just solving different problems.
In practice, many groups need both. First, they need to pull data into Excel from documents, files, or systems. Then they need to calculate something meaningful from that data, whether that's a running total, an area under a curve, a premium curve, or a forecast input. The hard part isn't the math or the import in isolation. It's the mess in between.
What "Integrate in Excel" Really Means
The phrase integrate in excel usually means one of two things.
The first is numerical integration. That's the calculus meaning. You have a function or a series of data points, and you need the area under the curve. Finance teams hit this in forecasting, rate modeling, and cumulative value calculations. Analysts hit it when they need to estimate totals from changing values over time.
The second is data integration. That's the business meaning. You have data in several places, and you need it combined inside Excel in a way that doesn't fall apart next week. That can mean importing invoices, linking a change order log to payables, or pulling multiple CSV exports into one refreshable table.
The confusion comes from real work
An operations manager might say, “I need to integrate these invoices in Excel,” and mean “combine and clean them.” A financial analyst might say the same thing and mean “compute a total from a variable rate series.”
Both are valid.
What trips people up is that most tutorials assume clean, friendly inputs. They show a perfect function, evenly spaced values, and a worksheet that starts in row 1 with neat headers. Real finance data doesn't look like that. As noted in this discussion of the gap around irregular datasets, tutorials rarely address noisy parsed PDFs, missing intervals, or cleanup work before integration, and forum threads on irregular-data integration often have solve rates below 20% (myengineeringworld.net discussion on Excel integration gaps).
Most Excel pain isn't caused by formulas. It starts earlier, when inconsistent source data gets treated like a finished dataset.
Why this matters before you choose a method
If your issue is duplicate vendor names, missing dates, and line items split across scans, calculus won't help. If your issue is estimating total exposure from a changing rate curve, Power Query alone won't finish the job.
That distinction also helps you see when Excel is still the right tool and when it's becoming a workaround. If your current process depends on one person remembering which tab to paste into, you're already close to the signs your business outgrew spreadsheets.
The useful way to think about Excel is simple:
- Use Excel as a calculator when the main problem is mathematical.
- Use Excel as a staging and reporting layer when the main problem is data coming from too many places.
- Use both together when documents feed models, reconciliations, or dashboards.
Calculate Area and Totals with Numerical Integration
If you need to integrate in excel in the mathematical sense, start with the least fancy method that matches the data you have.
For many business problems, you don't begin with a symbolic function. You begin with a column of dates, a column of values, and a request for a total. That's numerical integration. You're approximating the area under a curve from discrete points.
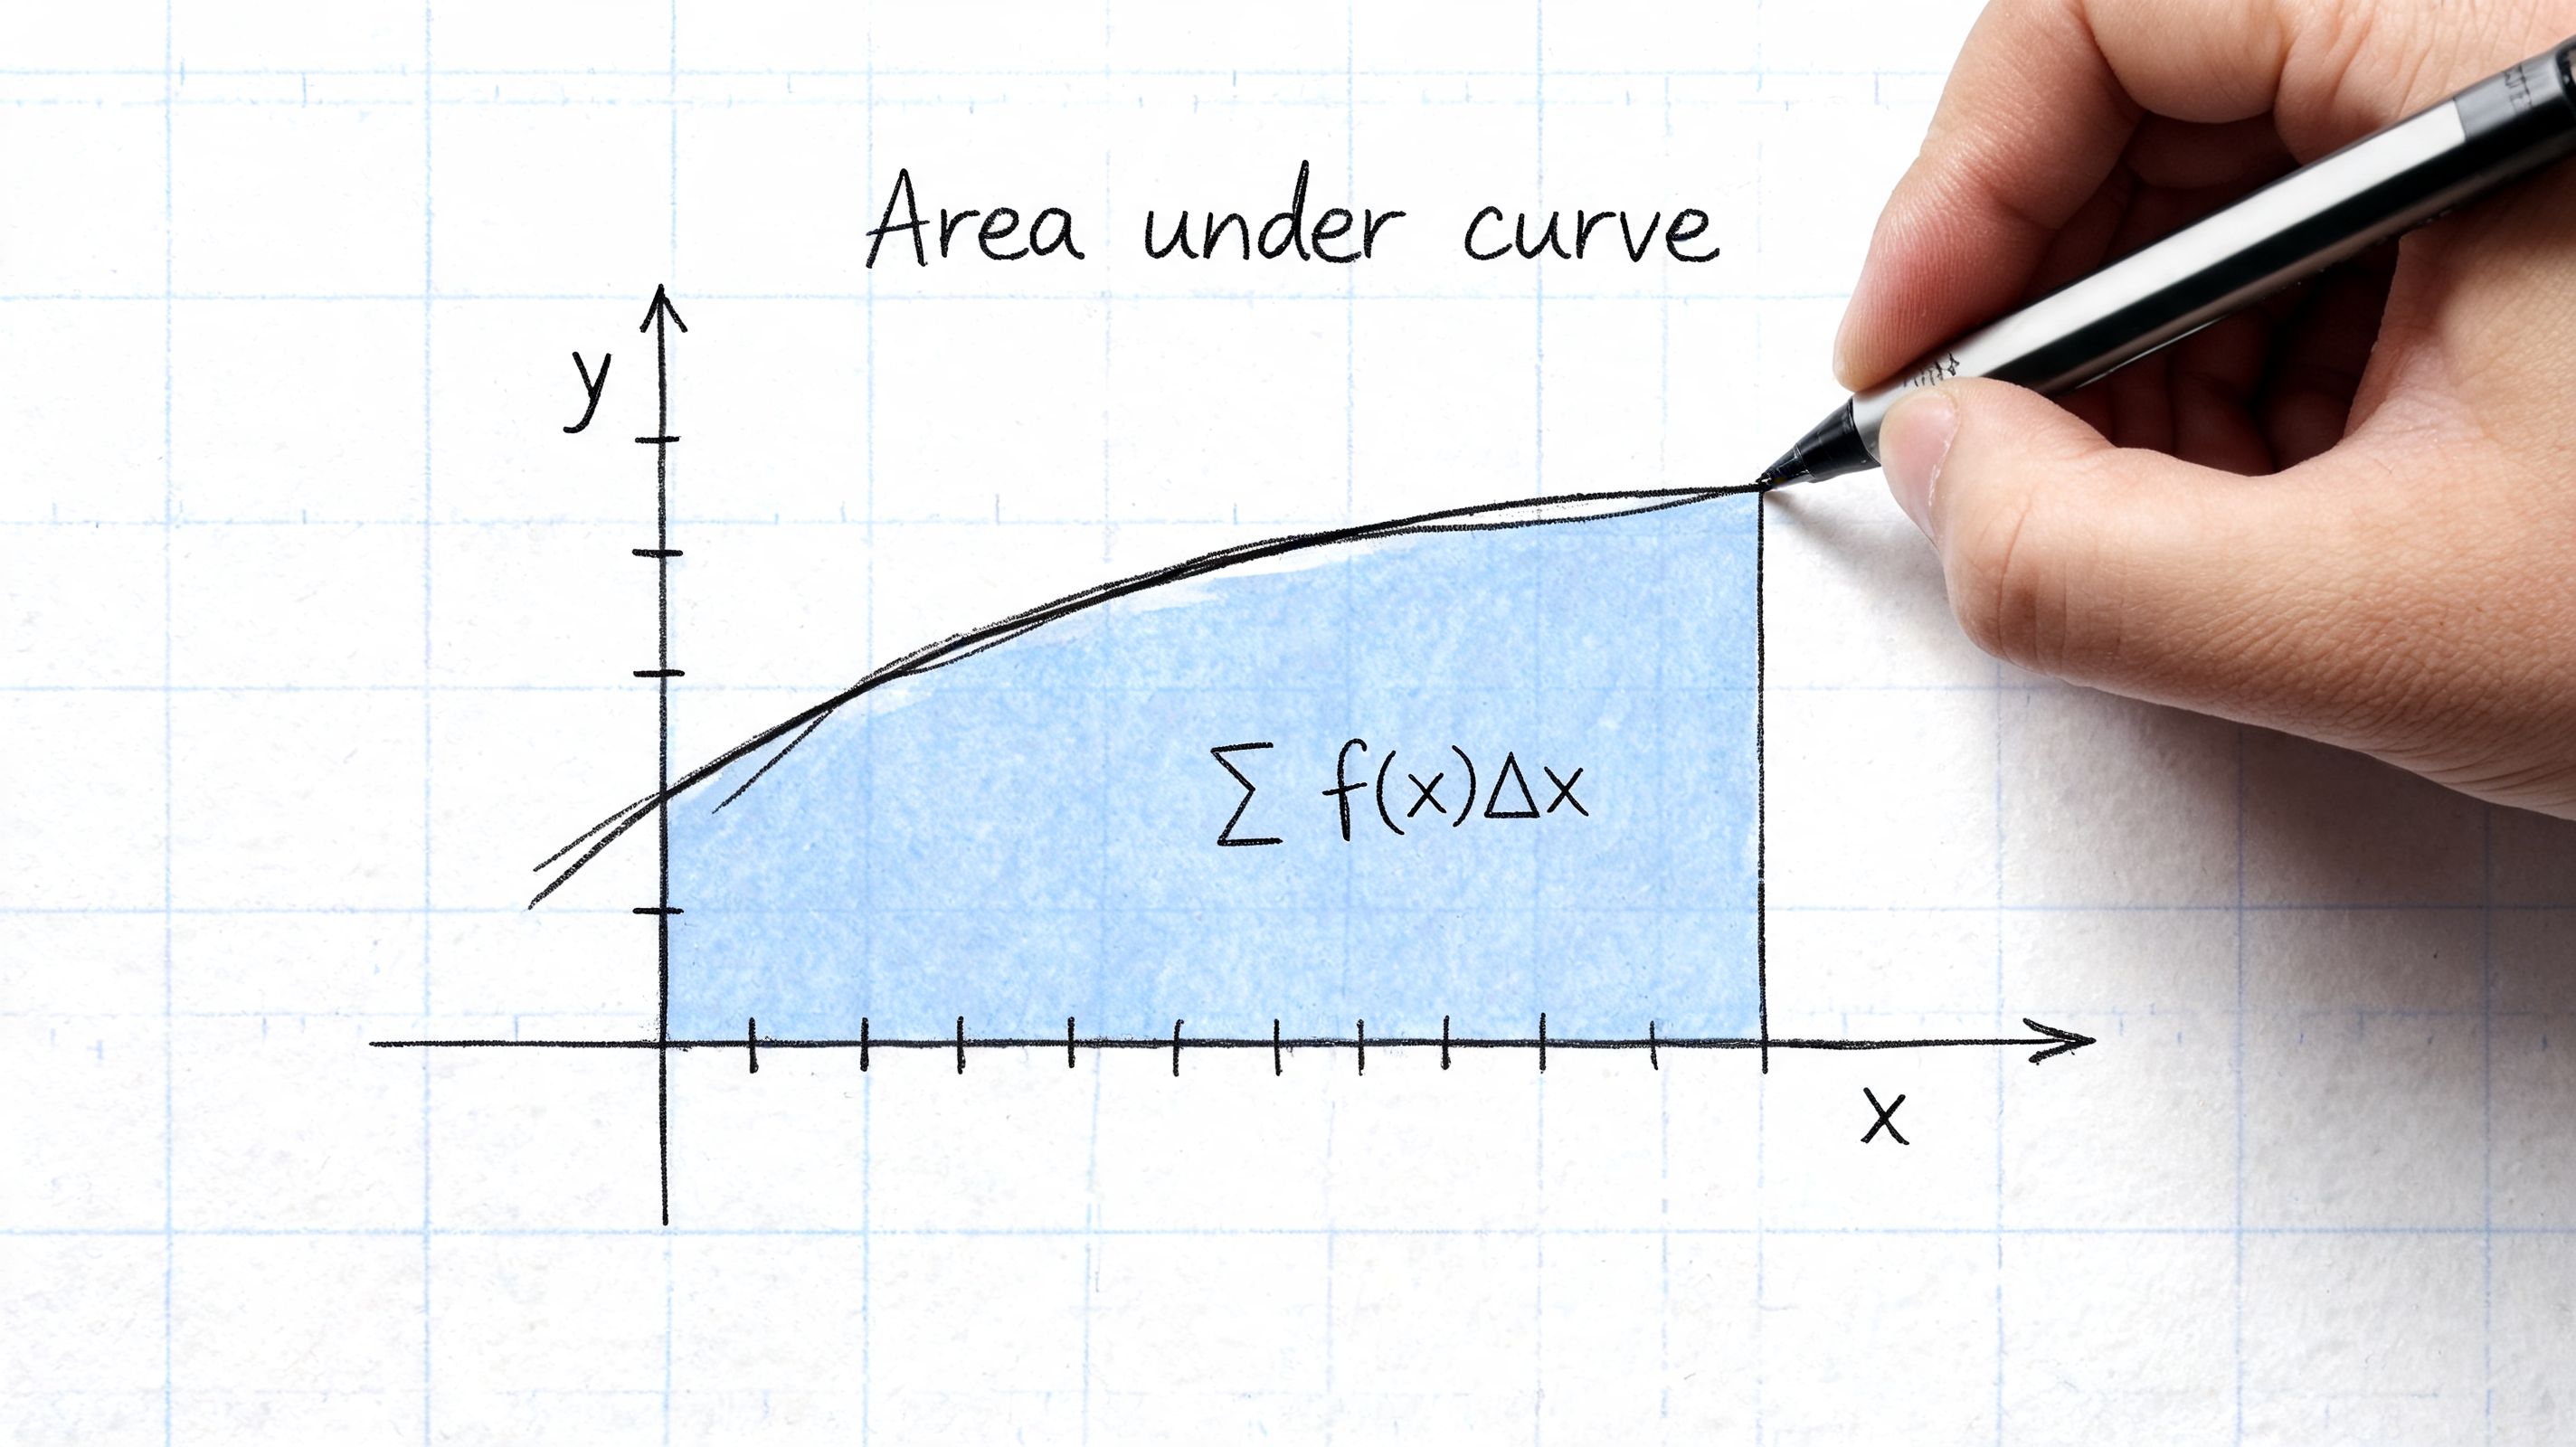
Start with discrete data, not theory
If your X values are equally spaced, a simple worksheet setup often does the job. Create one column for the interval width and another for the average of adjacent Y values. Multiply those together row by row, then sum the results.
That's the practical version of the Trapezoidal Rule. It works because each segment is treated like a trapezoid instead of a rectangle, which usually gives a better estimate when values change between points.
The standard form is:
Trapezoidal rule
∫_a^b f(x) dx ≈ (Δx/2) × (f(a) + 2∑f(x_i) + f(b))
Excel made this kind of work much more usable when the Analysis ToolPak arrived in Excel 5.0 in 1993, a milestone that brought statistical and engineering functions into normal business use. A later summary notes that a 2010 Journal of Accountancy study found 78% of finance professionals used Excel for numerical integration in forecasting and saved an average of 15 hours per month on manual calculations (Excelsior overview of Excel statistical tools).
A worksheet setup that works
Use a layout like this:
| X | Y | Delta X | Avg Y | Area Slice |
|---|---|---|---|---|
| x1 | y1 | |||
| x2 | y2 | =A3-A2 | =(B3+B2)/2 | =C3*D3 |
Fill down from the second data row. Then sum Area Slice.
This works well when:
- Your points are ordered and represent a continuous progression.
- The intervals are visible in the data instead of assumed.
- You care about an estimate, not symbolic calculus.
It works badly when:
- Rows are missing and you don't notice.
- X values are irregular but you treat them as uniform.
- Outliers came from bad source data, not real behavior.
When to use SUMPRODUCT
If your worksheet is already structured with interval widths and midpoints or averages, SUMPRODUCT is clean and fast. It's a good choice when you want one formula to aggregate many slices without helper totals scattered around the sheet.
A practical pattern is to calculate the per-row slice first, then use SUMPRODUCT only if the model needs to stay compact. People often jump to a monster formula too early. That makes audit work harder.
Practical rule: If someone else has to inspect your workbook later, helper columns beat cleverness.
ToolPak, Simpson's Rule, and add-ins
For smoother curves and higher precision, analysts often move beyond trapezoids. The broader Excel ecosystem supports Simpson's Rule and more advanced approaches through add-ins and VBA. Native Excel historically pushed users toward approximations, while specialized tools handled harder cases better.
That matters when you're dealing with improper integrals, singularities, or nested calculations. VBA-based add-ins such as QUADF are built for that class of problem, not for everyday spreadsheet arithmetic. Use them when the workbook is part of a serious analytical model and precision is part of the requirement.
For ordinary finance work, though, the best method is usually the one that survives handoff. A readable trapezoidal setup in Excel beats a black-box workbook that only one person can maintain.
Combine and Clean Data with Power Query
Those searching integrate in excel don't need calculus first. They need to stop copying data from one file into another.
That's where Power Query earns its place. It lets you connect to files, folders, and tables, then clean and reshape the data before it lands in the worksheet. The big shift is mental. You stop treating Excel as a paste target and start treating it as a refreshable pipeline.
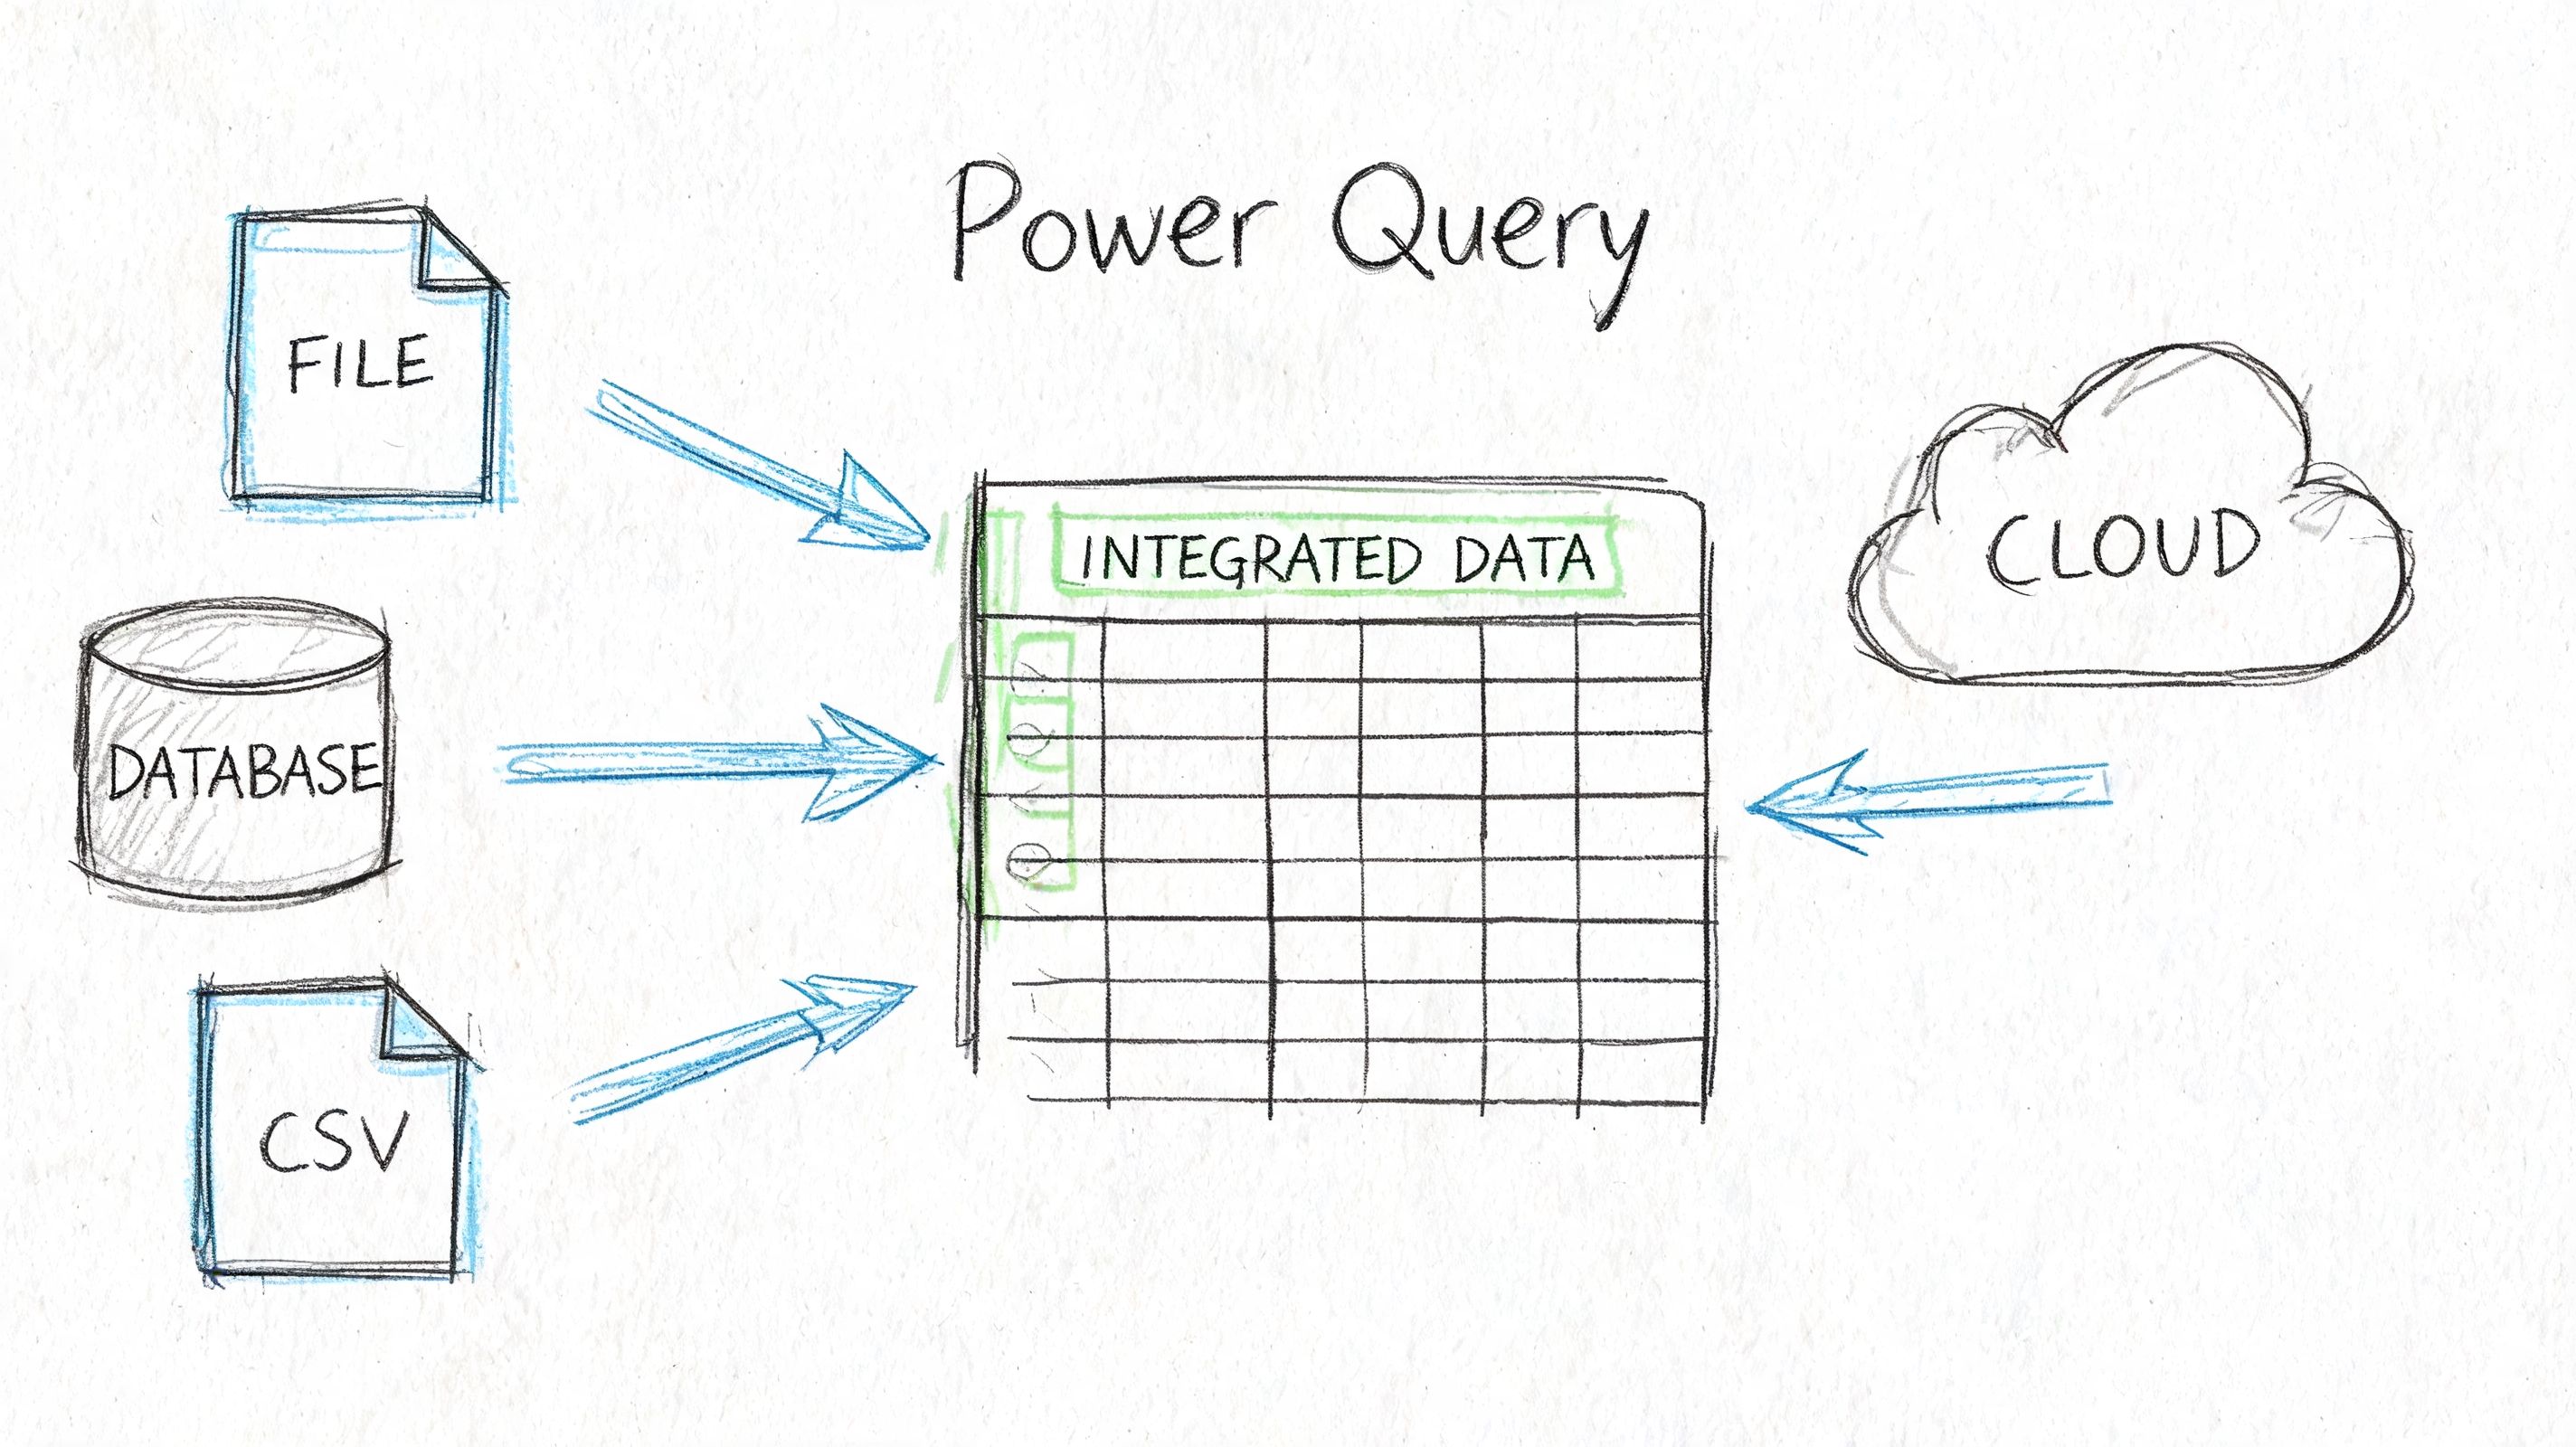
Why Power Query beats copy and paste
Manual consolidation creates three recurring problems:
- The same cleanup gets repeated every time a new file arrives.
- Column structures drift and nobody notices until a report breaks.
- Auditability disappears because edits happen directly in cells.
Power Query fixes that by storing the transformation steps. Import, remove columns, split text, change types, merge tables, refresh. Same process, same order, every time.
If your raw input starts as documents converted into spreadsheet-ready tables, this walkthrough on how to parse data in Excel is a useful companion because it deals with the handoff before Power Query takes over.
A practical import pattern
A solid workflow looks like this:
-
Connect to the source
Use Data > Get Data. Pull from an Excel file, CSV, PDF-supported source, or an entire folder when files arrive in batches. -
Normalize the structure
Promote headers, remove junk rows, fix data types, and rename fields to business names that make sense. -
Clean text early
Split vendor references, trim spaces, standardize date fields, and separate project codes from descriptions. -
Merge supporting tables
Join your transaction data to vendor masters, project lists, or approval logs. -
Load only what you need
Push the final result into a worksheet table, PivotTable source, or the data model.
What works and what doesn't
Power Query works well when the incoming mess is structural. Bad headers, extra rows, changing filenames, mixed file formats, repeated folder imports. That's its territory.
It doesn't solve judgment calls on its own. If a vendor appears under two legal names, or a scanned invoice shifted one line item into the wrong field, someone still has to define the business rule.
Clean data before formulas touch it. Once messy imports spread across worksheets, every downstream tab inherits the same problem.
A short walkthrough can help if you want to see the interface in action:
Think in refreshes, not one-time fixes
The best Power Query setups are boring. That's a compliment. New file arrives, refresh runs, output updates, dashboard stays intact.
Use that mindset with folders especially. If your month-end process involves “save attachment, rename file, open master workbook, paste values,” you've built a manual integration job. Power Query can usually replace the fragile parts with a repeatable flow.
Choosing Your Excel Integration Method
Most Excel problems get easier once you answer one question. What's the actual job?
If the job is to estimate a total from changing values over time, you're in numerical integration. If the job is to combine and clean records from multiple sources, you're in data integration. Some workflows need both, but they still happen in that order: clean first, calculate second.
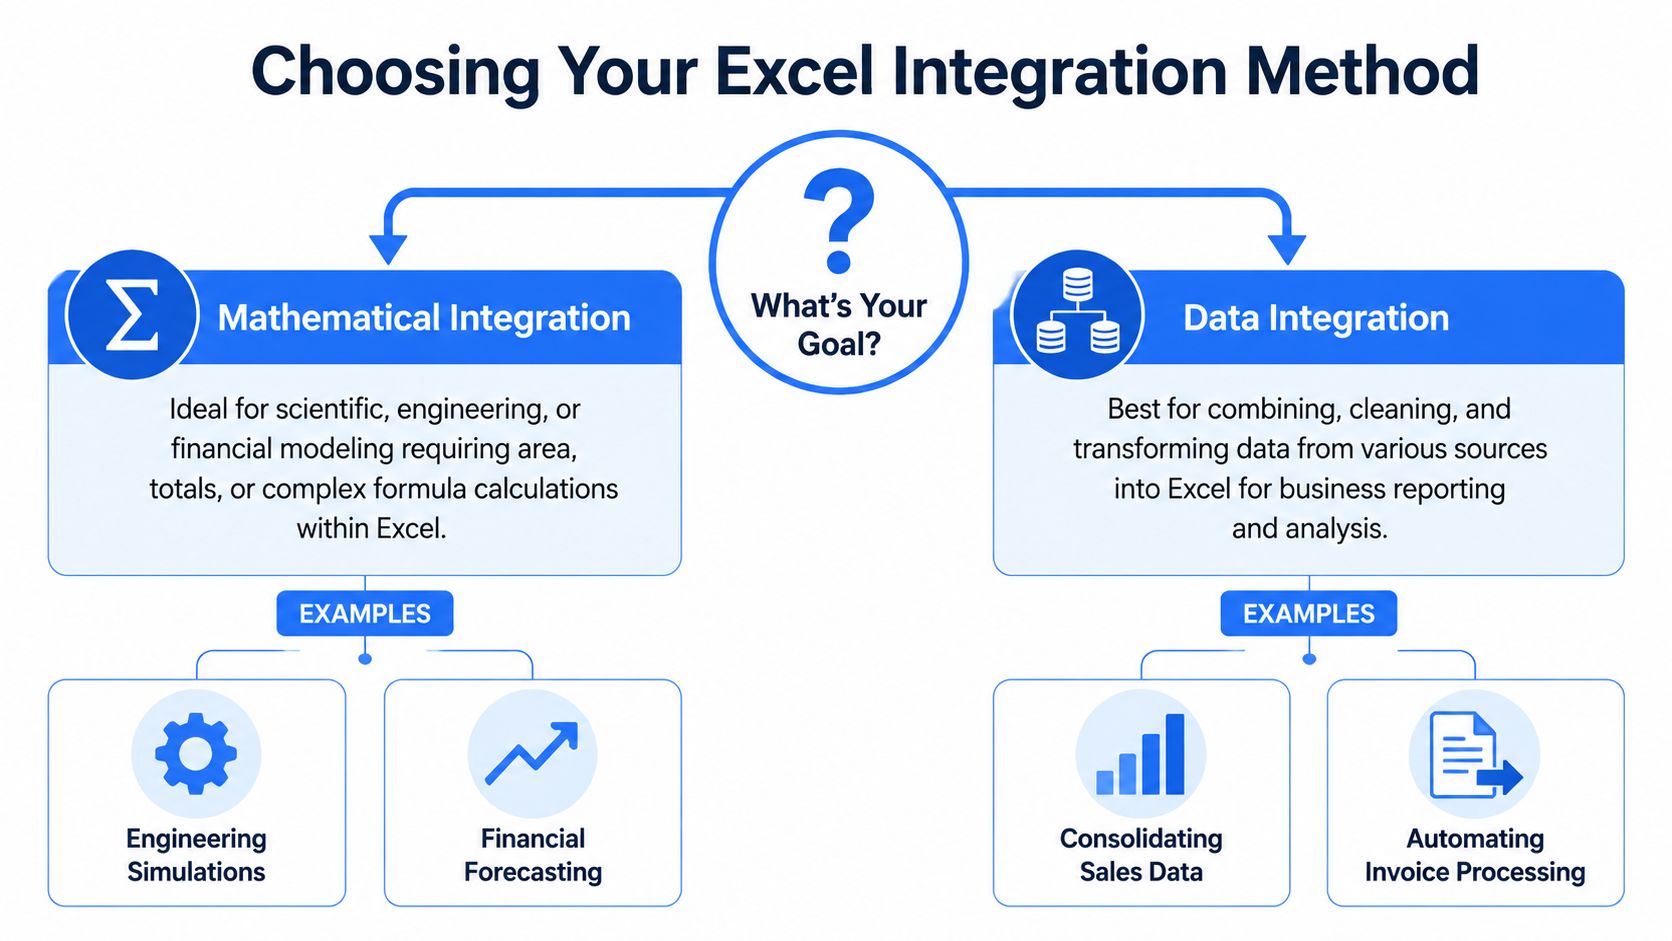
Excel integration methods compared
| Criterion | Numerical Integration | Data Integration |
|---|---|---|
| Primary goal | Estimate area, cumulative value, or totals from a function or XY series | Combine, clean, reshape, and standardize data from files or systems |
| Typical input | Ordered X and Y values, time series, model outputs | CSVs, workbooks, exported reports, parsed document tables |
| Best Excel tools | Helper columns, SUMPRODUCT, Trapezoidal Rule, ToolPak, VBA add-ins for advanced cases | Power Query, table merges, type conversion, refreshable folder imports |
| Common mistake | Assuming intervals are uniform when they aren't | Cleaning directly in worksheets instead of in the query |
| Best fit | Forecasting, engineering, actuarial-style modeling, rate curves | Invoice processing, reconciliation, multi-file reporting, audit prep |
When advanced math tools are worth it
Custom VBA isn't always necessary for everyday integration, though it is for some projects.
For harder numerical work, QUADF is one of the examples that shows where Excel's native methods run out of road. It can compute integrals with 12 to 15 decimal precision, handle singularities, and was cited as 200x faster than a 10,000-iteration Simpson's rule approximation in the referenced documentation. The same source notes a 2022 Gartner report that 65% of Fortune 500 finance teams use custom VBA for advanced analytics (ExcelWorks QUADF manual).
That doesn't mean every workbook should become a VBA project. It means advanced tools belong in advanced use cases.
A simple decision rule
Use this rule set when you're stuck:
- Choose formulas and numerical methods when the structure is already stable and the math is the main challenge.
- Choose Power Query when the source data changes shape, arrives in batches, or needs cleaning before analysis.
- Choose both when imported records eventually feed models, accruals, or forecast calculations.
If you're building toward more advanced spreadsheet work, this guide to Excel advanced skills is a good next step because it covers the habits that keep these models maintainable.
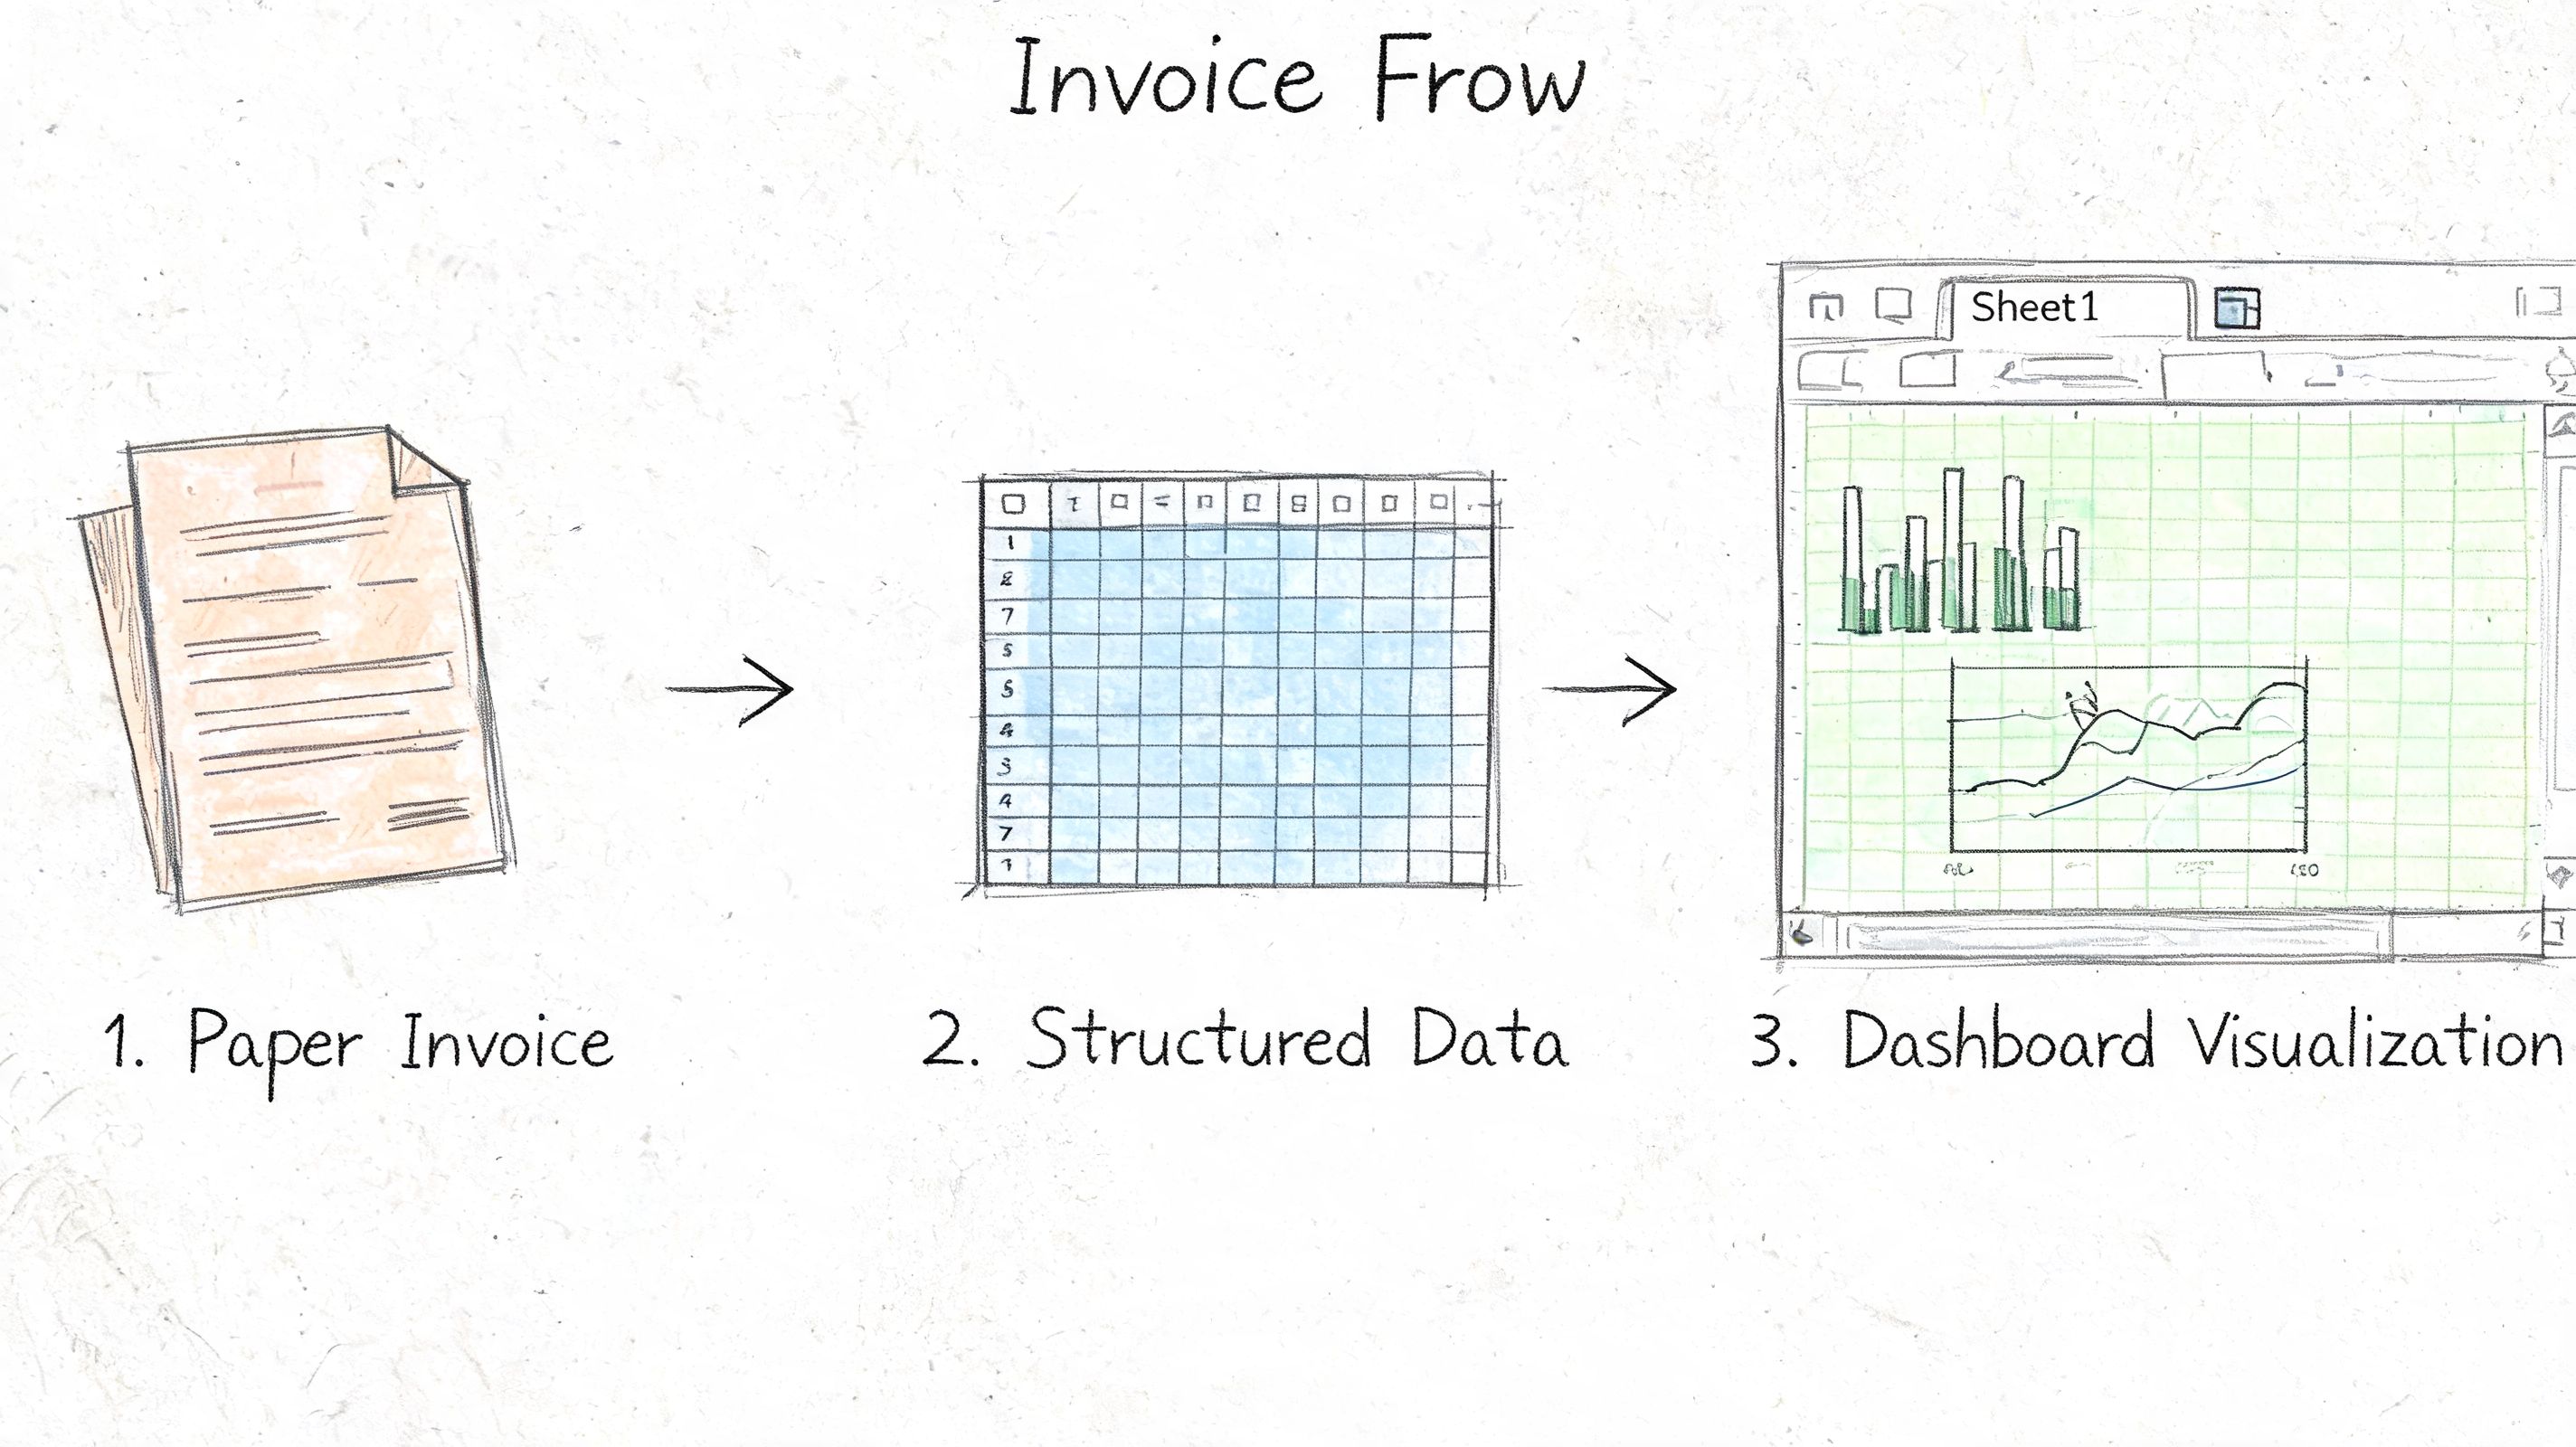
Workflow From Document to Dashboard with DocParseMagic
A construction finance team usually doesn't struggle with one file. It struggles with a stack of them.
Subcontractor invoices come in as PDFs. Lien waivers arrive as scans. Approved change orders live in another workbook. The payables tracker has its own naming conventions, and someone still has to answer a basic question before payment goes out: does this invoice match what was approved, and is the waiver status correct?
That's where a document extraction layer matters. A tool like DocParseMagic can turn those mixed files into structured tables first, which gives Excel something clean enough to work with.
Start with a normalized export
Once invoice and waiver data has been extracted into a spreadsheet, the Excel side gets much simpler. Build the process around a few stable fields:
- Project Name
- Invoice Number
- Amount
- Due Date
- Vendor
- Job Number
- Is Final
Those fields line up well with established construction payable practices around waivers and invoice tracking. The point isn't elegance. The point is consistency.
Bring it into Power Query first
Import the parsed file through Power Query instead of opening it and editing directly. That lets you enforce the same cleanup every time.
Typical steps:
- Fix data types early so dates load as dates and amounts load as numbers.
- Trim vendor names to remove leading or trailing spaces that break matching.
- Split composite fields if one extracted column contains job code and description together.
- Append monthly files from a folder if invoices arrive continuously.
At this stage, you can also add business flags. If your team needs a review queue, create simple conditional columns for incomplete records, likely duplicates, or missing project codes.
Validate against the records that matter
Construction payables break down when the team validates against the wrong thing. Invoice totals alone aren't enough. The stronger check is against the approved change order and the legal entity on the contract.
The established workflow in this area uses Power Query for import, XLOOKUP to match invoice amounts against approved change orders, and data validation to distinguish partial from final waivers. Following that process can reduce payment disputes by 92%, while mismatched legal names can still create a 35% failure rate if they aren't handled correctly (Mastt guidance on lien waiver workflows).
A practical formula pattern looks like this:
- Vendor match with
XLOOKUPagainst a vendor master list - Change order validation with
XLOOKUPagainst approved CO numbers and amounts - Waiver status with an
IFfield based on the final/partial indicator - Retainage tracking with
SUMIFSon project and vendor combinations
If the legal entity on the waiver doesn't exactly match the contracting party, stop there. Spreadsheet automation can accelerate a bad payment just as efficiently as a good one.
Keep the review layer visible
A lot of teams automate import and validation, then hide the exceptions. That's backwards. Exceptions are the whole point.
Use a review sheet or query output that highlights:
| Check | What to flag |
|---|---|
| Vendor mismatch | Parsed vendor name doesn't match master legal name |
| Amount mismatch | Invoice amount differs from approved change order amount |
| Waiver issue | Final waiver marked as partial, or waiver missing |
| Project coding gap | Job number absent or not found in project list |
This gives AP staff a short queue of records that need judgment instead of forcing them to inspect every line.
Build the dashboard last
Once the query output is stable, create a PivotTable-based dashboard. Keep it operational, not decorative.
Useful views include:
- Invoices by project
- Invoices pending waiver review
- Matched versus unmatched vendors
- Approved versus flagged payment amounts
This works because the dashboard is only reading a cleaned and validated table. New documents come in, the extraction output updates, Power Query refreshes, lookup checks rerun, and the dashboard reflects the current state without manual rebuilds.
That's the point where “integrate in excel” stops meaning one isolated trick and starts meaning an actual workflow. Documents become structured data. Structured data gets validated. Validated data feeds reporting.
Moving Beyond Integration to Automation
Getting data and math to behave inside Excel is already a win. But the bigger payoff comes when the process keeps running without constant supervision.
That's the progression. First, you learn to integrate in excel. Then you stop rebuilding the same workbook every month. Then you start designing flows where imports refresh, checks rerun, and reporting updates with minimal manual work.
What changes when integration is done properly
Three things usually happen:
- Data entry shrinks because imports replace retyping.
- Review quality improves because exception handling becomes visible.
- Analysis gets better because people spend less time assembling numbers and more time interpreting them.
That shift matters in finance and operations because the expensive part of spreadsheet work usually isn't the spreadsheet. It's the human time spent wrestling with avoidable cleanup.
Good Excel automation doesn't remove judgment. It reserves judgment for the records that actually need it.
Where to go next
If you want to keep building from here, the next layer is usually outside the worksheet itself.
You can push refreshes and notifications with Power Automate. You can move summary reporting into Power BI when leaders need dashboards instead of tabs. And if budgeting or forecasting is part of your broader process, this a no-jargon guide to financial planning is a helpful reference because it frames planning systems in plain terms instead of software jargon.
Excel still earns its place. It just works best when it's no longer doing every job by itself.
If your team is buried in invoices, statements, waivers, or policy files, DocParseMagic can give Excel a much cleaner starting point. It turns messy business documents into structured, analysis-ready tables, so your imports, validations, and dashboards start with usable data instead of manual cleanup.