
10 Essential Excel Advanced Skills for Finance and Ops Teams in 2026
If your team’s idea of an expert is someone who writes a complex VLOOKUP, you're leaving countless hours and critical insights on the table. In modern finance and operations, true proficiency goes far beyond basic formulas. It means automating the mundane, analyzing complex datasets with precision, and turning raw data from documents into strategic assets.
This guide moves past generic tips and focuses on the specific excel advanced skills that deliver real results. We will cover everything from cleaning messy data with Power Query to building automated reconciliation models with dynamic arrays. Forget theory; we provide practical, real-world examples for teams that handle invoices, commission reports, vendor proposals, and policy documents daily.
You will learn how to turn document-heavy tasks into streamlined, error-proof workflows. We'll explore powerful tools like Power Pivot, dynamic arrays, and even simple automation with Office Scripts, showing you exactly how to apply them. To truly master your data and improve team productivity, understanding a comprehensive range of advanced Excel skills is essential. Prepare to learn the functions and techniques that not only look great on a resume but fundamentally change how you work with spreadsheets.
1. Power Query for Data Transformation and Cleaning
Power Query is one of the most powerful excel advanced skills for anyone who regularly works with messy data. Integrated directly into Excel (in the "Data" tab), it’s a data transformation engine that lets you connect to various sources, clean and shape the information, and then load it into a worksheet or data model. Think of it as a repeatable, automated recipe for cleaning your data without ever touching the original source file.
For finance and operations teams, this is a game-changer. Instead of manually deleting columns, splitting text, and fixing formats every month, you build a cleaning process once in the Power Query Editor. Every subsequent time you refresh the data, Power Query applies all your saved steps automatically.
Practical Use Cases
- Accounting Teams: After using a tool like DocParseMagic to extract line items from hundreds of vendor invoices, Power Query can automatically normalize the data. It can split product codes from descriptions, standardize date formats (
MM/DD/YYvs.DD-Mon-YYYY), and remove unwanted "Total" rows. - Insurance Carriers: When extracting policy details from PDFs, policyholder names might appear differently (
John A. Smithvs.Smith, John). Power Query can standardize these names into a consistent "Last Name, First Name" format and convert text-based dates into actual date values for accurate term calculations. - Procurement Specialists: Consolidate proposal data from multiple suppliers, each with their own unique spreadsheet format. Power Query can unpivot the data, realign columns, and create a single, unified table for easy comparison.
Actionable Tips for Implementation
- Create a "Staging" Query: For complex transformations, import your raw data into a base query. Then, have other queries reference this staging query. This way, if you need to make a change to the source connection or an initial cleaning step, you only have to edit it in one place.
- Use Conditional Columns: This feature lets you create new columns based on logical rules. For example, you can create a column that flags invoices where the sum of line items does not match the stated total, instantly highlighting discrepancies.
- Document Your Steps: By default, Power Query names steps like "Changed Type" or "Filtered Rows." Rename each step in the "Applied Steps" pane to describe what it does (e.g., "Removed Unnecessary Columns," "Standardized Vendor Names"). This creates a clear audit trail for colleagues and your future self.
Power Query is particularly effective when dealing with information extracted from documents. You can explore how to get data from a PDF directly into Excel, which serves as the perfect starting point for an automated cleaning workflow.
2. Advanced VLOOKUP and INDEX/MATCH Formulas
Mastering lookup formulas is a fundamental excel advanced skill for connecting disparate datasets. While VLOOKUP is widely known, the combination of INDEX and MATCH provides a more powerful and flexible way to retrieve values. INDEX/MATCH overcomes VLOOKUP's limitations by allowing you to look up data in any column and return a value from any other column, even to the left of the lookup column.
For operations and finance teams, this is crucial for reconciling information. After extracting data from documents like invoices or policy forms, you often need to match it against a master list to verify details, pull in related data like pricing or commission rates, or flag discrepancies. INDEX/MATCH is the perfect tool for this, handling complex matching scenarios with reliability.
Practical Use Cases
- Accounts Payable Teams: Match vendor invoice numbers extracted from PDFs to a master purchase order (PO) list.
INDEX/MATCHcan retrieve the corresponding PO amount and flag any invoices that don't have a matching PO number for investigation. - Insurance Brokers: After extracting policy numbers from carrier commission statements, use
INDEX/MATCHto look up those numbers in a separate commission rate table. This allows for the automatic calculation of broker compensation for each policy. - Procurement Teams: When comparing vendor proposals, use
INDEX/MATCHto check proposed prices against a historical pricing database. This quickly identifies if a vendor's pricing is an outlier compared to past projects or other bids.
Actionable Tips for Implementation
- Handle Errors Gracefully: Wrap your
INDEX/MATCHformula in anIFERRORfunction. Instead of displaying#N/Afor unmatched values, you can return a more user-friendly result like "Not Found," 0, or a blank cell (e.g.,=IFERROR(INDEX(...), "Not Found")). - Create Helper Columns for Multi-Criteria Lookups: If you need to match on multiple fields (like Vendor Name and Invoice Date), create a "helper" column in both tables that concatenates these fields into a unique ID (e.g.,
=A2&B2). You can then perform a singleINDEX/MATCHon this unique ID. - Always Use Exact Match: For financial reconciliation, always use
0orFALSEfor the[match_type]argument in yourMATCHfunction. This ensures you only find exact matches, preventing costly errors from approximate lookups. If you are on Microsoft 365, consider switching toXLOOKUPfor a simpler syntax and improved performance.
3. Pivot Tables and Pivot Charts for Data Analysis
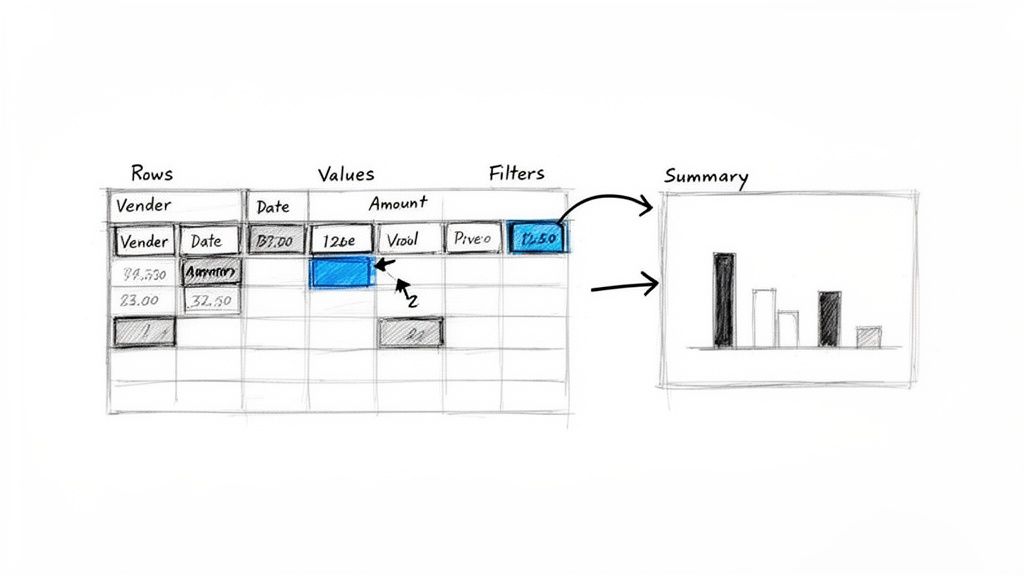
Pivot Tables are one of the most essential excel advanced skills, serving as interactive summaries that let you reorganize and analyze large datasets without writing a single formula. They allow you to rapidly aggregate information, find patterns, and present insights by dragging and dropping fields into rows, columns, and value areas. For teams drowning in raw data, Pivot Tables transform dense spreadsheets into actionable business intelligence.
Instead of manually filtering, sorting, and summing, you can create a summary in seconds. This is especially powerful for finance and operations roles where you need to look at data from multiple angles, such as viewing total invoice spend by vendor one moment and by department the next.
Practical Use Cases
- Accounting Teams: After extracting data from hundreds of invoices, create a Pivot Table to quickly identify the top 10 vendors by spend, analyze payment term cycles, or spot spending anomalies within specific expense categories.
- Insurance Carriers: Summarize policy data extracted from PDFs to analyze premiums by agent, underwriting region, and policy type. A Pivot Chart can instantly visualize which regions are generating the most revenue.
- Procurement Teams: Compare vendor proposals by dragging cost, delivery time, and feature scores into a Pivot Table. This provides a clear, side-by-side comparison for making informed sourcing decisions.
- Loan Processors: Summarize income documents by applicant type and document source to understand application trends and identify potential bottlenecks in the data collection process.
Actionable Tips for Implementation
- Use Slicers for Interactivity: Add Slicers to your Pivot Table (found under the "Analyze" tab). These are user-friendly buttons that filter the data, allowing even non-technical users to build their own custom reports and dashboards.
- Create Calculated Fields: Instead of adding new columns to your source data, create a Calculated Field directly within the Pivot Table. This is perfect for calculating ratios like "Cost per Unit" or "Invoice Amount vs. PO Amount" for variance analysis.
- Group Data Intelligently: The "Group" feature is invaluable for summarizing data. You can group daily dates into months and quarters, or group numeric values into ranges (e.g., creating age brackets or price tiers).
- Keep Source Data Separate: Always place your Pivot Table on a different worksheet from your raw data. This keeps your workbook organized, prevents accidental modification of the source data, and makes it easier to manage.
Pivot Tables are most effective when fed clean, structured information. Mastering the process of data extraction from PDF to Excel is a critical first step, ensuring your analysis is built on a solid foundation.
4. Data Validation and Conditional Formatting for Quality Control
Data Validation and Conditional Formatting are essential excel advanced skills for maintaining data integrity. Data Validation controls what users can enter into a cell, preventing errors at the source, while Conditional Formatting applies visual cues like colors or icons to cells based on their values. Used together, they create a powerful quality control system that instantly flags errors, outliers, and inconsistencies.
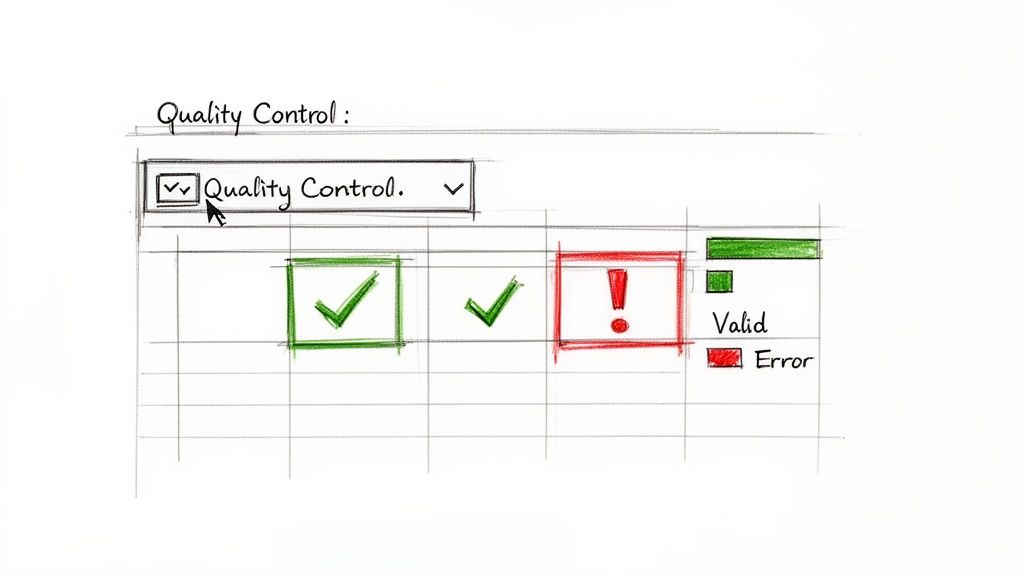
For teams processing documents like invoices or policy forms, this combination is a must-have. After data is extracted, you can apply rules to automatically highlight suspicious values, such as an invoice total that is 50% higher than the historical average for that vendor, or ensure that only pre-approved vendor names can be entered in a column. This front-end validation saves countless hours of downstream cleanup.
Practical Use Cases
- Accounts Payable Teams: Use Conditional Formatting to highlight invoices where required fields like vendor name, invoice number, or due date are missing. Data Validation dropdowns can enforce consistent vendor names.
- Insurance Brokers: Flag policies with premium amounts that fall outside a normal, pre-defined range. This helps catch data extraction errors or identify unusual policies that require a manual review.
- Procurement Teams: Color-code proposal data to visually identify which vendors submitted the most competitive bids on specific line items, making side-by-side comparisons much faster.
- Construction Project Managers: Automatically flag subcontractor invoices where the billed amount exceeds the approved contract value, preventing overpayments before they happen.
Actionable Tips for Implementation
- Create Dropdown Lists: Use Data Validation to create dropdown lists from a set of approved values (e.g., a list of vendor names or product codes). This standardizes entries and eliminates typos.
- Flag Inconsistent Totals: Apply a Conditional Formatting rule using a custom formula like
=[InvoiceTotalCell]<>SUM([LineItemsRange]). This will instantly highlight any invoice where the stated total does not match the sum of its line items. - Use Data Bars and Icon Sets: Apply Data Bars to quickly spot outliers in columns with numerical data, like invoice amounts or policy premiums. Use Icon Sets (e.g., red/yellow/green lights) to show variance from a budget or expected value.
- Combine with IFERROR: Create a validation rule that flags any blank or unparseable dates extracted from documents. A formula like
=NOT(ISERROR(DATEVALUE(A1)))can check if a cell contains a valid date.
5. XLOOKUP and Advanced Lookup Functions (Excel 365)
XLOOKUP is the modern, flexible replacement for older functions like VLOOKUP and INDEX/MATCH, making it a critical one of the excel advanced skills for anyone with an Excel 365 subscription. It simplifies the process of finding information in a table or range by row. Unlike VLOOKUP, XLOOKUP can look to the left, return multiple results, and has a built-in, customizable error handler, eliminating the need for cumbersome IFERROR wrappers.
For finance and operations professionals, this means cleaner, more intuitive, and more robust formulas. You can look up a value in one column and return a corresponding value from any other column without rearranging your data. This is especially powerful when comparing data extracted from documents against master files.
Practical Use Cases
- AP Teams: After extracting vendor names and invoice amounts, use XLOOKUP to match the vendor name against a master PO list. If no match is found, the formula can automatically return a status like "No PO Match" instead of an ugly
#N/Aerror, instantly flagging items for review. - Insurance Underwriters: Match an extracted policy applicant's ID against a risk assessment database. XLOOKUP can pull the applicant's risk score, and if the applicant is new, it can return a default value like "Standard Risk - New Applicant" to ensure no application is left unrated.
- Procurement Teams: Compare pricing from multiple vendor proposals extracted into a single sheet. XLOOKUP can pull the contracted rate for each line item from a vendor master file, making it easy to spot discrepancies between proposed and agreed-upon pricing.
Actionable Tips for Implementation
- Use the
[if_not_found]Argument: Instead of nesting XLOOKUP in anIFERRORfunction, use its built-in fourth argument. For example,XLOOKUP(lookup_value, lookup_array, return_array, "Not Found")creates much cleaner reports by replacing errors with a meaningful text string. - Leverage Spill Functionality: If you need to return an entire row or multiple adjacent columns for a match, simply select that entire range in the
return_arrayargument. XLOOKUP will automatically "spill" the results into the neighboring cells without complex array formulas. - Use Search Modes for Efficiency: For large, sorted datasets, set the
[match_mode]to2for binary search. This can dramatically speed up calculation time. For finding the last occurrence of a value, use the[search_mode]argument and set it to-1(search last-to-first). - Confirm Team Compatibility: Before sharing a workbook that uses XLOOKUP, ensure all recipients have an Excel 365 subscription. If not, the formulas will result in
#NAME?errors. For compatibility with older Excel versions, stick to INDEX/MATCH.
6. Dynamic Arrays and FILTER/SORT Functions
Dynamic arrays represent a fundamental shift in how formulas work and are one of the most practical excel advanced skills for modern data analysis. Available in Microsoft 365, this feature allows a single formula to automatically return, or "spill," results into multiple cells. This eliminates the need for legacy array formulas (Ctrl+Shift+Enter) or manually dragging formulas down columns.

Functions like FILTER, SORT, UNIQUE, and SEQUENCE are built to take advantage of this behavior. Instead of complex, nested IF statements or relying on pivot tables for simple views, you can now write one clear formula to instantly create a new, filtered, or sorted table. This is incredibly useful for finance and operations teams who need to create summary reports from large datasets.
Practical Use Cases
- AP Managers: Use
SORTandFILTERin combination to create a prioritized payment list. The formula=SORT(FILTER(InvoiceData, InvoiceData[Status]="Awaiting Payment"), 5, -1)could display all unpaid invoices, sorted by the due date in descending order. - Insurance Carriers: After extracting policy data from PDFs, an underwriter can use
FILTERto instantly display all policies that match a specific underwriting status and have a premium above a certain threshold. - Procurement Teams: Apply
UNIQUEto a column of vendor names extracted from multiple proposal documents. This instantly generates a clean list of all distinct vendors who submitted a proposal, which can then feed a summary dashboard. - Sales Operations: A manager can filter a master commission report to show only representatives whose sales are below a target, creating an instant "coaching list" that updates automatically as the source data changes.
Actionable Tips for Implementation
- Combine FILTER and SORT: Create powerful, self-updating reports by nesting functions. The formula
=SORT(FILTER(data, criteria))lets you build a filtered view that is always sorted, which is perfect for exception reporting. - Use Multiple Criteria in FILTER: To create highly focused views, use multiplication
(*)for AND logic or addition(+)for OR logic within theFILTERfunction's criteria. For example:FILTER(data, (vendor="ABC") * (amount>1000)). - Beware the #SPILL! Error: This error occurs if there isn't enough empty space for the formula's results to spill into. Always ensure the cells below and to the right of your dynamic array formula are clear of other data.
- Generate Dynamic Numbering: Use
=SEQUENCE(ROWS(filtered_data))next to a filtered list to create a dynamic row count (1, 2, 3...) that automatically adjusts as yourFILTERresults change.
7. Power Pivot and Data Modeling for Complex Analysis
While standard PivotTables are great for summarizing a single flat file, Power Pivot introduces a new level of analytical depth, making it one of the most essential excel advanced skills for data-driven teams. It is an internal data modeling engine that allows you to build relationships between multiple, separate data tables and analyze millions of rows with impressive speed, right within Excel.
For professionals working with data extracted from various documents, this is a major advantage. You can link information from invoices to vendor master files or connect insurance policy details to claims data without first mashing them together with VLOOKUPs. Power Pivot lets you create a relational data model, enabling far more intricate and meaningful analysis.
Practical Use Cases
- Insurance Carriers: After extracting data from policies, claims forms, and agent commission tables, you can model the relationships. This allows for powerful analysis, like calculating profitability by agent, policy type, and region.
- Procurement Teams: Link vendor proposal data with historical performance records and internal spend reports. This creates a unified view to identify the best-value suppliers, not just the cheapest ones.
- Accounting Teams: Analyze invoice aging across multiple vendors and business units. By relating invoice tables to cost center directories and payment logs, you can build dynamic reports that show exactly where cash is tied up.
Actionable Tips for Implementation
- Start Small: Begin your data model with just two or three related tables, such as a sales table and a customer table. Validate the relationship and ensure your PivotTables work as expected before adding more complexity.
- Use Descriptive Naming: Clearly name your tables (e.g., "Invoices," "Vendors") and columns ("InvoiceDate," "VendorName"). This makes the relationship diagram intuitive and easy for others to understand.
- Prioritize One-to-Many Relationships: Whenever possible, structure your data to have a primary key in one table that relates to multiple entries in another (e.g., one vendor has many invoices). This is cleaner and more efficient than many-to-many relationships.
- Document Your Model: Use the diagram view in Power Pivot to visualize relationships. Add notes or a separate worksheet to document what each table contains and how your calculated measures (DAX formulas) are defined. This is invaluable for team collaboration.
8. Custom Functions with VBA and User-Defined Functions (UDF)
While Excel's built-in function library is extensive, sometimes you need a calculation so specific to your business that no standard formula exists. This is where VBA (Visual Basic for Applications) and User-Defined Functions (UDFs) become an essential excel advanced skills for creating bespoke logic. A UDF is a custom function you build using VBA code that works just like a native Excel function such as SUM or VLOOKUP.
This capability is perfect for finance and operations teams that rely on proprietary business rules. Instead of building monstrous, nested formulas that are impossible to audit, you can create a simple, reusable function like =CalculateCommission(sales_amount, rate_tier) that encapsulates all the complex logic behind the scenes.
Practical Use Cases
- Insurance Brokers: Create a custom function to calculate tiered commissions. For example, a UDF could automatically apply a 5% commission on the first $50,000 of a premium, 7% on the next $50,000, and 10% on anything above, based on the policy type.
- Procurement Specialists: After extracting data from vendor proposals, use a UDF to calculate a "Total Cost of Ownership" score. The function could combine line-item pricing, implementation fees, and ongoing maintenance costs into a single, comparable metric for each supplier.
- Loan Processors: Develop a UDF that parses text extracted from a financial statement narrative to find a specific data pattern, like a loan amount (
=ExtractLoanAmount(A2)), returning only the numerical value from a sentence like "The applicant was approved for a loan of $350,000."
Actionable Tips for Implementation
- Always Use
Option Explicit: PlaceOption Explicitat the very top of your VBA module. This forces you to declare all your variables, which helps you catch typos and prevent common coding errors early on. - Add Input Validation: Build checks into your UDF to handle bad data gracefully. For instance, verify that an input meant to be a number is actually numeric before performing calculations, preventing
#VALUE!errors. - Document Your Code: Use comments within the VBA editor to explain what your function does, what each parameter represents, and what it returns. This documentation is invaluable for anyone (including your future self) who needs to understand or modify the code later.
- Create a Reusable Add-In: If a set of UDFs is useful for your entire team, save the workbook as an Excel Add-in (
.xlamfile). Team members can install the add-in once to get access to all your custom functions in any workbook they open.
9. Power Automate Integration for Workflow Automation
Power Automate is one of the most practical excel advanced skills for automating tasks that span multiple applications. As part of the Microsoft Power Platform, it lets you create "flows" that connect Excel to hundreds of other services like Outlook, SharePoint, Slack, and even accounting systems. This means you can automate processes that start or end in your spreadsheet without writing a single line of code.
For finance and operations professionals, Power Automate acts as the digital glue between your data sources and your business systems. Imagine you use DocParseMagic to extract invoice data into an Excel file. Instead of manually copying that data into QuickBooks, you can build a Power Automate flow that does it for you automatically every time a new row is added to your spreadsheet.
Practical Use Cases
- Accounts Payable Teams: A flow can monitor a specific Excel Online table for new invoice entries. When a new row from DocParseMagic appears, it can automatically create a corresponding bill in QuickBooks or NetSuite, attaching the original PDF for reference.
- Insurance Carriers: When policy details are parsed and added to an Excel sheet, a flow can trigger an approval process. If a policy premium is above a certain threshold, it sends an approval request to a manager via Teams or Outlook before the data is moved to the core policy system.
- Procurement Teams: Automate notifications by connecting your Excel proposal log to Slack. When a new vendor proposal is parsed and its details are logged, a flow can instantly post a message in a dedicated channel, alerting the procurement team to begin their review.
Actionable Tips for Implementation
- Use Excel Online as the Trigger: While Power Automate can work with desktop Excel, using Excel Online (stored in OneDrive or SharePoint) provides a more reliable and "always-on" trigger for your workflows.
- Create a Dedicated 'Automation' Worksheet: Keep your workbook organized by creating a specific sheet where Power Automate reads from or writes to. This separates your raw data and analysis from the data used in automated flows, preventing accidental interference.
- Implement Error Handling: In your flow, add steps to catch and log failures. For instance, if an invoice fails to sync to your accounting software, the flow can send an email to an admin with the specific error details, allowing for quick troubleshooting.
- Test with Sample Data First: Before deploying a flow that moves critical financial data, run it with a small set of sample data parsed from documents. This ensures all the mapping and logic works as expected without affecting your live production environment.
To further explore how Power Automate can streamline operations, you can find examples of practical Power Automate workflows for non-technical users. By connecting Excel to the wider world of applications, you can move beyond simple spreadsheet calculations and begin automating repetitive tasks across your entire organization.
10. Excel Tables and Structured References for Dynamic Ranges
Excel Tables are one of the most practical excel advanced skills for ensuring your formulas and charts update automatically. By converting a static range of cells into a formal Table (Ctrl+T), you create a dynamic, self-expanding container for your data. This eliminates the common and error-prone task of manually updating formula ranges like A1:D500 to A1:D600 every time new data is added.
For finance and operations professionals, this feature is foundational for building reliable reports. When new data is parsed from a document using a tool like DocParseMagic and added to a Table, all connected formulas, PivotTables, and charts immediately include it. This creates a robust and scalable data management system directly within your spreadsheet.
Practical Use Cases
- Accounting Teams: After importing parsed invoices into an Excel Table, a formula calculating invoice aging can be added to one column. This formula will automatically fill down for every new invoice row that is added, providing a perpetually up-to-date aging report.
- Insurance Carriers: Load extracted policy data into a Table. Formulas can then be set to automatically calculate remaining premium terms or flag policies nearing their renewal date. As new policy data is appended, these calculations extend without any manual intervention.
- Procurement Teams: Use a Table to consolidate proposal data from multiple vendors. A linked PivotTable can then summarize total costs by vendor. When a new quote is added to the Table, the PivotTable instantly updates upon refresh, reflecting the new information.
Actionable Tips for Implementation
- Immediate Conversion: As soon as you import or paste data, convert it into a Table using the shortcut
Ctrl+T. This should be the very first step to ensure all subsequent work is dynamic. - Use Descriptive Names: In the "Table Design" tab, give your table a meaningful name (e.g.,
InvoiceDatainstead ofTable1). This makes your formulas with structured references (like=SUM(InvoiceData[Amount])) easy to read and understand. - Embrace Structured References: Instead of using cell ranges like
A2:A100in your formulas, use structured references likeTableName[ColumnName]. This reference automatically expands as the table grows, making your formulas future-proof. - Enable the Total Row: In the "Table Design" tab, check the "Total Row" box. This adds a final row that can perform quick calculations like SUM, AVERAGE, or COUNT on any column without writing a separate formula.
Top 10 Advanced Excel Skills Comparison
| Tool / Technique | Implementation Complexity 🔄 | Resource & Compatibility ⚡ | Expected Outcomes ⭐📊 | Ideal Use Cases 📊 | Key Advantages / Tips 💡 |
|---|---|---|---|---|---|
| Power Query for Data Transformation and Cleaning | Moderate–High: GUI easy, advanced requires M language | Requires Excel Professional; handles millions of rows; cloud queries have 30-min timeout | Reusable ETL steps, standardized cleaned data, reduces manual errors ⭐⭐⭐⭐ | Cleansing parsed invoices, statements, policies before analysis or system import | Use staging queries, enable auto-refresh, name steps for audit trails |
| Advanced VLOOKUP and INDEX/MATCH Formulas | Low–Moderate: formula-based; INDEX/MATCH steeper | Works in most Excel versions; performance drops on very large tables | Accurate reconciliations when data is clean; reliable matching ⭐⭐⭐ | Reconciling parsed data against master vendor/policy lists | Use IFERROR, helper columns for multi-criteria; prefer XLOOKUP when available |
| Pivot Tables and Pivot Charts for Data Analysis | Low–Moderate: drag-and-drop; advanced features take practice | Built into Excel; may slow with very large datasets (10M+) | Fast interactive summaries and trend detection; great for exec reporting ⭐⭐⭐⭐ | Summarizing spend, vendor analysis, policy trends, dashboards | Place pivots on separate sheets, use slicers, refresh on open |
| Data Validation and Conditional Formatting for Quality Control | Low–Moderate: rule setup can be complex | Native Excel features; may slow recalculation on huge sheets | Immediate visual flags and enforced consistency; reduces downstream errors ⭐⭐⭐ | Flagging anomalies, enforcing formats, pre-import QC | Combine with protected sheets, highlight exceptions, avoid excessive rules |
| XLOOKUP and Advanced Lookup Functions (Excel 365) | Low: simpler syntax than legacy lookups | Requires Excel 365 subscription; not backward compatible | Cleaner, faster lookups with built-in error defaults; scalable ⭐⭐⭐⭐ | Modern reconciliation workflows in organizations on Excel 365 | Use default return for no-match, combine with FILTER for multiple matches |
| Dynamic Arrays and FILTER/SORT Functions | Low–Moderate: new paradigm; learning curve for spill behavior | Excel 365 only; spill conflicts possible | Dynamic, auto-expanding reports; reduces helper columns ⭐⭐⭐⭐ | Real-time filtered lists, exception reports, dynamic dashboards | Use UNIQUE/SORT(FILTER()) patterns; manage spill ranges carefully |
| Power Pivot and Data Modeling for Complex Analysis | High: requires DAX and modeling skills | Requires Excel Professional/Power BI; excellent for millions of rows | Scalable, high-performance multi-table analysis; single source of truth ⭐⭐⭐⭐ | Cross-table analysis (policies, claims, invoices) and enterprise reporting | Start small, name tables clearly, document relationships and DAX measures |
| Custom Functions with VBA and UDFs | High: programming required; debugging effort | Macro-enabled workbooks; limited in Excel Online/Mac; security considerations | Enables bespoke business logic and automation; centralizes rules ⭐⭐⭐ | Complex commission rules, contract validations, custom parsing logic | Use Option Explicit, sign macros, document parameters, consider add-ins |
| Power Automate Integration for Workflow Automation | Low–Moderate: low-code flows; complex scenarios add work | Cloud-based; requires Microsoft account and sometimes premium connectors | Automates data movement, alerts, approvals; reduces manual entry ⭐⭐⭐ | Pushing parsed data to ERP/CRM, approval workflows, notifications | Use Excel Online triggers, implement error handling and logging |
| Excel Tables and Structured References for Dynamic Ranges | Low: easy to apply; structured syntax to learn | Native Excel; slight metadata overhead | Auto-expanding ranges, cleaner formulas, reduces range errors ⭐⭐⭐ | Continuously importing parsed documents that grow over time | Convert on import (Ctrl+T), use descriptive table names, enable total row |
| Power Query + Power Pivot (combined workflow) | High: combines ETL + modeling skills | Requires Excel Professional/Power BI; best on 64-bit for very large data | Robust, scalable analytics pipeline: clean, related, and fast queries ⭐⭐⭐⭐ | Enterprise-grade analysis across mixed document types | ETL in Power Query, load to Data Model, document steps and relationships |
From Skills to Strategy: Your Path to Excel Mastery
You've just explored a powerful set of excel advanced skills, from the data-cleaning prowess of Power Query to the analytical depth of Power Pivot and the automation potential of VBA and Power Automate. Seeing these skills laid out as a list can be intimidating, but it's important to view them not as individual hurdles but as interconnected tools in a larger strategic toolkit. The journey to mastery isn't about memorizing every function; it's about fundamentally changing how you approach data problems.
The true value emerges when you stop seeing Excel as a simple grid for manual entry and start seeing it as a dynamic environment for building resilient, automated data workflows. This shift in mindset is the most critical takeaway. Instead of reacting to data requests, you begin to build systems that anticipate them, turning hours of tedious work into a few clicks.
Your Actionable Path Forward
The path from learning to application is where real growth happens. Don't try to master everything at once. Instead, adopt a phased approach that builds momentum and delivers tangible results for your team.
-
Start with Structure: Your first step should be to move away from unstructured ranges. Make Excel Tables your default for any new data set. This single change makes your formulas dynamic and your data management immensely easier, setting the foundation for everything that follows.
-
Automate Your Worst Task: Identify the most repetitive, mind-numbing data-cleaning task your team performs. Is it consolidating commission reports from different reps? Is it cleaning up downloaded bank statements for reconciliation? Target that one process and apply Power Query to automate it from start to finish. Document your steps so the process can be shared and repeated.
-
Upgrade Your Analysis: Once your data is clean and structured, graduate from basic SUM and COUNT functions. Build your next summary report using a Pivot Table. If you're using Excel 365, challenge yourself to replace an old, complex nested IF formula with a more readable combination of XLOOKUP and FILTER.
-
Connect and Scale: After automating a few internal processes, look for opportunities to connect Excel to the outside world. Explore how Power Automate can save an email attachment and trigger your Power Query workflow automatically. This is where you begin to build a truly hands-off system.
The goal is not just to become faster at Excel; it is to build systems that reduce the need for manual intervention altogether. Your objective is to spend less time in the spreadsheet and more time acting on the insights from the spreadsheet.
Mastering these excel advanced skills transforms your role from a data processor into a strategic analyst. For finance, operations, and procurement teams, this means less time spent copying and pasting from invoices, policies, and vendor proposals, and more time spent on variance analysis, forecasting, and negotiation. You become the person who provides the "why" behind the numbers, not just the numbers themselves. This journey builds your value, empowers your team, and creates a measurable impact on your organization's bottom line. Start small, aim for a single win, and build from there.
Ready to skip the most tedious step in your workflow? While these advanced skills are perfect for analyzing data, DocParseMagic handles the painful extraction before you even open Excel. Stop manually transcribing invoices, reports, and statements and start with clean, structured data ready for your analysis. Visit DocParseMagic to see how you can automate your document-to-spreadsheet pipeline in minutes.